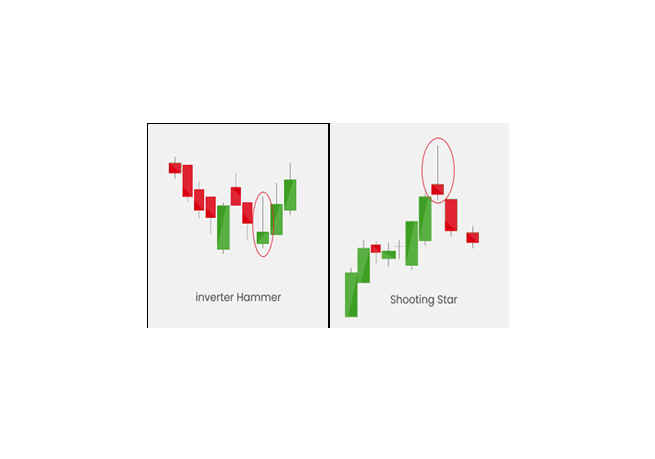
Shooting Star candlestick pattern
In technical analysis, a shooting star formation is viewed as a bearish reversal candlestick pattern that typically occurs at the top of an uptrend. In contrast, Inverted Hammers look similar to Shooting Stars but are found after a downtrend, so their implications are different. The Shooting Star formation occurs when the open, low, and close are roughly the same. Additionally, there is a long upper shadow, which should be at least twice as long as the real body. This long upper shadow indicates that selling pressure emerged near the resistance area or tested the supply zone. Consequently, the bullish trend was resisted by the sellers. For bearish confirmation, the price needs to trade below the shooting star candle low on the following day.