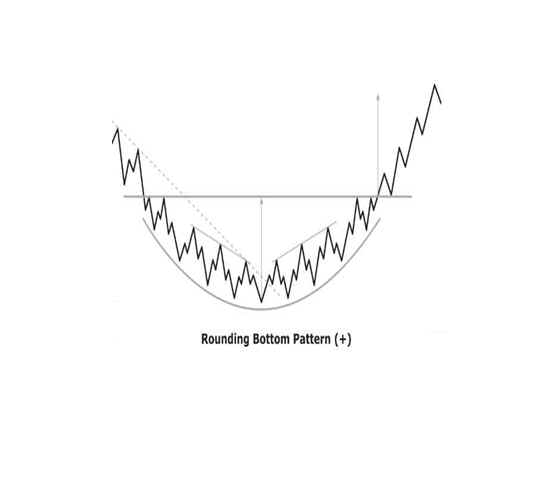
Rounding bottom pattern
A rounding bottom pattern is a bullish reversal chart pattern in technical analysis that can occur at the end of a downtrend. It is also known as a saucer bottom due to its shape, which resembles a saucer or a bowl. The pattern is formed when a security's price falls to a low level, then consolidates into a basing pattern that gradually turns upward with a gentle curve, eventually breaking through a resistance level.
The rounding bottom pattern is considered important in technical analysis because it can provide a signal that a stock's downtrend may be coming to an end and that a new uptrend may be emerging. The gradual curve of the pattern indicates that buyers are gradually gaining strength, while the resistance level is broken when there is enough demand to push the price higher. When the resistance level is broken, it can provide confirmation of a potential trend reversal and the start of a new uptrend.
Traders and investors can use the rounding bottom pattern to identify potential opportunities to buy stocks that have been in a downtrend. They can look for stocks that have been declining in the price for an extended period of time and have formed a rounding bottom pattern. Traders can then use technical analysis tools, such as moving averages or volume indicators, to confirm the strength of the trend reversal and make informed trading decisions.
It is important to note that technical analysis is not foolproof and that there is always a risk involved in trading. It is essential to use risk management strategies, such as stop-loss orders and position sizing, to minimize potential losses. Additionally, traders should consider using a combination of technical analysis and fundamental analysis to gain a more comprehensive understanding of a stock's potential for growth and value.