Renko charts:
Renko charts are a type of chart used in technical analysis to display the price movements of an asset. Renko charts are unique in that they are not based on time, but instead, use price movement to determine when to add a new brick to the chart.
Here's how Renko charts work:
Bricks are added to the chart only when the price has moved a certain amount.
The size of the brick is determined by the trader and can be adjusted to create a more detailed or less detailed chart.
Each brick on the chart represents a specific price range.
When the price moves in the opposite direction, a new brick is started in the opposite direction.
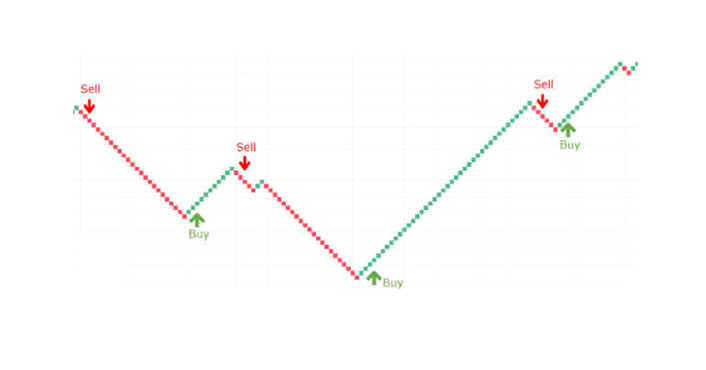
When using Renko charts to take buy or sell signals, traders typically look for patterns and trends in the brick formations. One common strategy is to wait for a series of bricks in the same direction, indicating a trend, and then enter a trade in the same direction as the trend. For example, if a series of bullish (upward) bricks are formed, a trader may take a long position. Conversely, if a series of bearish (downward) bricks are formed, a trader may take a short position.
Advantages of Renko Charts:
1. Clear and easy to read: Renko charts are easy to read and understand. They provide a clear and concise visual representation of the price movements of an asset, making it easier for traders to identify patterns and trends.
2. Filters out the noise: Renko charts filter out minor price movements and focus only on significant price changes. This helps to reduce noise and provides a clearer picture of the overall trend.
3. No time axis: Renko charts do not use a time axis, so they can be used to analyze price movements over any time period. This allows traders to analyze price movements over long periods without being influenced by short-term fluctuations.
4. Can be used with other indicators: Renko charts can be used in conjunction with other technical indicators to make more accurate trading decisions.
Disadvantages of Renko Charts:
1. Limited information: Renko charts do not provide as much information as other chart types. They do not show the opening, high, and low prices of an asset.
2. May not work for all assets: Renko charts may not work for all types of assets. For example, assets that are highly volatile or have frequent price fluctuations may not be suitable for Renko charts.
In summary, Renko charts can be a useful tool for traders, but they should be used in conjunction with other technical indicators and should not be relied on solely for making trading decisions. Traders should also be aware of the limitations of Renko charts and use them in combination with other analysis techniques.