Rate of Change (ROC)
ROC, or Rate of Change, is a technical analysis indicator that measures the percentage change in a stock's price over a specified period of time. The ROC (12) indicator specifically measures the percentage change in a stock's price over the past 12 periods.
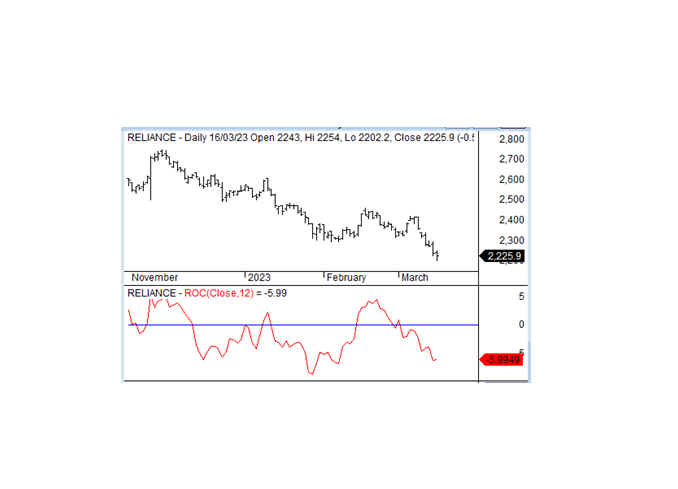
The values for the ROC (12) indicator can range from negative to positive. If the ROC (12) is above 0, it indicates that the stock's price has increased over the past 12 periods, and the stock is considered to be in a bullish trend. Conversely, if the ROC (12) is below 0, it indicates that the stock's price has decreased over the past 12 periods, and the stock is considered to be in a bearish trend.
Traders can use the ROC (12) indicator for buying and selling stocks by using the following strategies:
Momentum: If the ROC (12) is positive, it indicates that the stock's price has increased over the past 12 periods, and the stock may continue to gain momentum. Traders may consider buying the stock to profit from the upward momentum. If the ROC (12) is negative, it indicates that the stock's price has decreased over the past 12 periods, and the stock may continue to lose momentum. Traders may consider selling the stock to profit from the downward momentum.
Divergence: Traders can also look for divergences between the ROC (12) indicator and the stock's price. If the stock is making new highs while the ROC (12) indicator is not, it may suggest that the uptrend is losing momentum and that it may be time to sell the stock. Conversely, if the stock is making new lows while the ROC (12) indicator is not, it may suggest that the downtrend is losing momentum and that it may be time to buy the stock.
It is important to note that the ROC (12) indicator, like all technical indicators, should be used in conjunction with other tools and analysis to make informed trading decisions. Additionally, traders should be aware of the limitations of the indicator, such as its tendency to give false signals in choppy or sideways markets.