
NIFTY TECHNICAL ANALYSIS
Based on Market Closing Data as of Tuesday, March 19, 2024
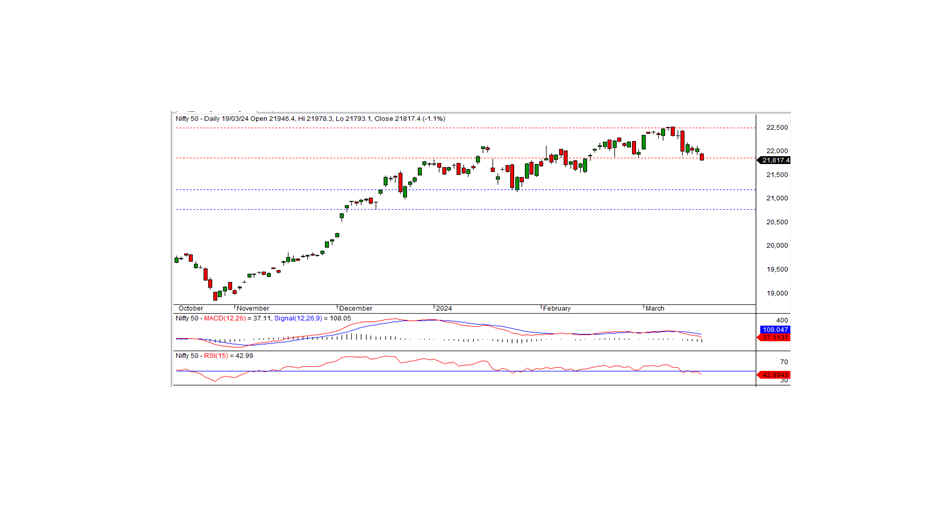
During the recent trading session, the Nifty concluded at 21817.45, marking a decrease of -238.25 points or -1.08 percent. Should the Nifty persist below the 21850 level, a continuation of the bearish trend may be anticipated in subsequent sessions.
In the preceding trading session, the Nifty commenced at the 21946.40 level with a negative tone, reaching an intraday low of 21793.100 before ultimately settling at 21817.45. All sectors exhibited a downward bias, with notable declines seen in IT, media, pharma, and FMCG. Market breadth leaned towards the negative side, with 671 stocks witnessing gains, 1757 experiencing losses, and 136 remaining unchanged. Among the top performers within the Nifty were BAJFINANCE, BAJAJ-AUTO, KOTAKBANK, and HINDALCO, while notable decliners included BPCL, TCS, CIPLA, and TATACONSUM.
Technically, the Nifty remains situated below short-term moving averages, with momentum indicators signaling a negative trajectory. Additionally, the index formed a black candle on the daily chart and closed beneath the short-term support level of 21850, indicating a negative bias. Sustained trading below this level could prolong the downtrend in subsequent sessions. The nearest short-term support is situated at the 21200 level. For a pullback rally to occur, the index must surpass 21870 intraday resistance.
Intraday Levels: Support - 21800, 21725, 21650; Resistance - 21870, 21950, 22025 (Based on 15-Minute Charts)
Positional Trading: Short-term Support - 21200-20750; Resistance - 21850-22500.
BANK NIFTY
In the previous trading session, the Bank Nifty ended at 46384.80, a decline of -191.10 points. From a technical perspective, momentum indicators are signaling a negative trend, with the index positioned below short-term moving averages. Additionally, the formation of a Doji candle on the daily chart, coupled with a close below the previous day's level, suggests the potential continuation of the downtrend. Intraday support is observed near the 46250 level, while resistance is noted at 46500. For a pullback rally, the index needs to surpass the resistance of 46500.
For intraday traders, key support levels are identified at 46250, 46100, and 45900, while resistance levels are situated at 46500, 46700, and 46900, as indicated by the 15-minute charts.
Positional traders should monitor short-term support levels at 46000-44500, with resistance at 47000 -48500.
