Price action technique
Price action is a technique used in technical analysis to analyze the movement of an asset's price on a chart. This approach relies solely on the historical price movements of an asset to identify patterns, trends, and key levels of support and resistance. Price action traders believe that all the information needed to make trading decisions is contained within the price movements of the asset, without needing to rely on external factors such as news events or economic data.
Price action traders look for patterns that can be used to predict future price movements. Some of the most common price action patterns include:
Candlestick patterns: Price action traders typically use candlestick charts to analyze price movements. Candlestick charts display the opening, closing, high, and low prices of an asset over a given time period. Traders look for specific candlestick patterns such as doji, hammer, and engulfing patterns, which can indicate potential changes in trend.
Chart patterns: Traders also look for chart patterns such as head and shoulders, double tops and bottoms, and triangles. These patterns can signal potential breakouts or breakdowns in price.
Support and resistance levels: Price action traders look for support and resistance levels, which are areas where the price has previously bounced off or broken through. These levels can be used to identify potential entry and exit points for trades.
Trend lines: Traders use trend lines to identify the direction of the trend. An uptrend is defined by a series of higher highs and higher lows, while a downtrend is defined by a series of lower highs and lower lows.
Price action signals: Price action traders look for specific price action signals, such as pin bars, inside bars, and engulfing patterns. These signals can indicate potential changes in price direction.
Price action traders typically use tight stop losses and position sizing to manage risk. They may also use price action signals and support/resistance levels to set profit targets. Price action trading requires patience and discipline, as traders must wait for clear signals and avoid impulsive trades based on emotions or market noise.
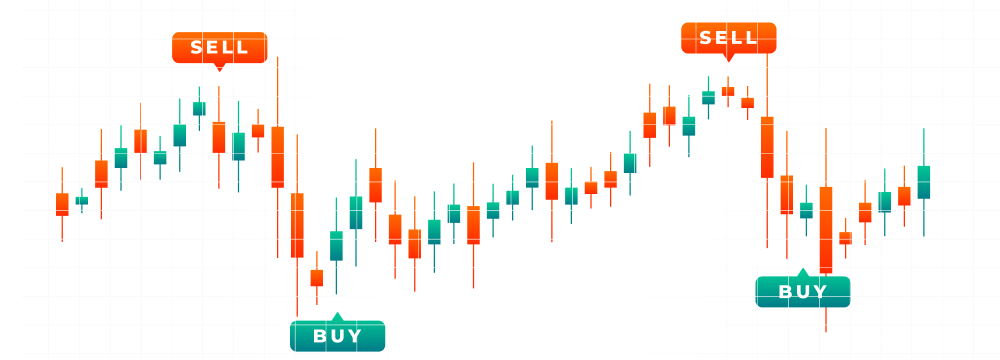
Here is an example of how price action analysis can be applied to a chart:
Let's say you are analyzing the price action of the Nifty50. You notice that the price has been in a downtrend for the past few weeks, making lower lows and lower highs. You draw a trend line connecting the highs and notice that the price has recently bounced off the trend line and is now heading higher.
You also notice a bullish engulfing candlestick pattern on the chart, which is a reversal pattern that suggests a potential change in trend. Based on these signals, you decide to enter a long position.
In conclusion, price action is a popular technique used in technical analysis to analyze the historical price movements of an asset. Traders use various tools such as candlestick patterns, chart patterns, and trend lines to identify potential trading opportunities. By analyzing price action, traders can make informed trading decisions without relying on external factors such as news events or economic data.