NIFTY Technical Outlook
Based on Market Closing on Thursday, June 13, 2024
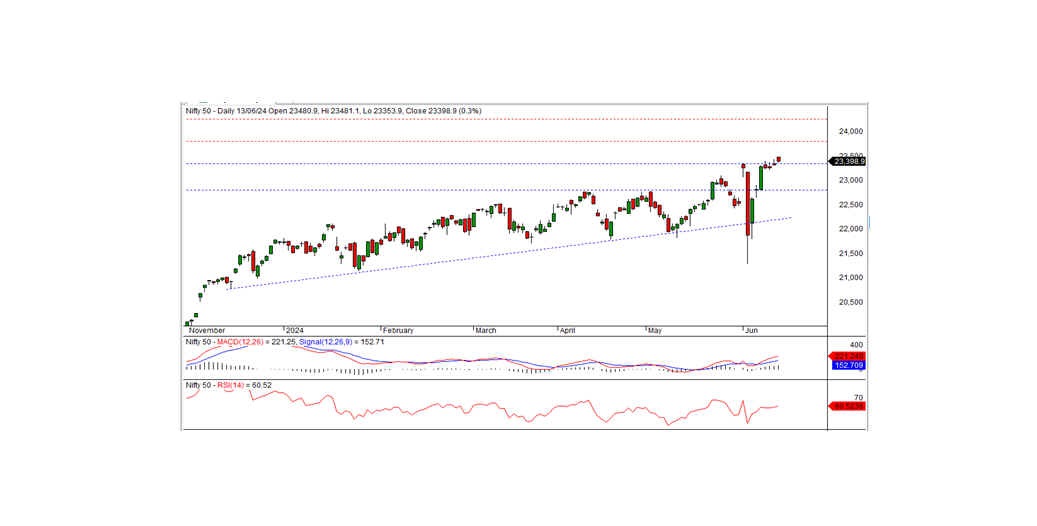
In the latest trading session, the Nifty closed at a record high of 23,398.90, up 75.95 points or 0.33%. The positive trend is expected to continue if the index stays above the short-term support level of 23,340.
The session began with the Nifty opening at a record high of 23,480.90. The index then gradually declined, reaching an intraday low of 23,353.90, before closing at 23,398.90. The biggest gainers were the realty, IT, auto, and pharma sectors, while the media, FMCG, and banking sectors were the biggest losers. Market breadth was positive, with 1,534 stocks rising, 976 falling, and 104 remaining unchanged. The top gainers on the Nifty were SHRIRAMFIN, HDFCLIFE, DIVISLAB, and M&M, while the major losers included HINDUNILVR, AXISBANK, BRITANNIA, and ICICIBANK.
From a technical standpoint, momentum indicators signal a positive trend. The Nifty remains above both its long-term and short-term moving averages. Despite forming a black candle on the daily chart, the index closed at a record high, suggesting the possibility of a continued uptrend. On the higher side, the index faces intraday resistance at the 23,485 level. If the index surpasses this level, the bullish trend is likely to continue in the coming days. Otherwise, the index may consolidate below this level for a few days. The nearest intraday support is at the 23,350 level.
Intraday Levels: Support: 23,350, 23,225, 23,100 Resistance: 23,485, 23,600-23,700 (15-Minute Charts)
Positional Trading: Short-term Support: 23,340-22,800 Resistance: 23,800-24,250
BANK NIFTY Technical Outlook
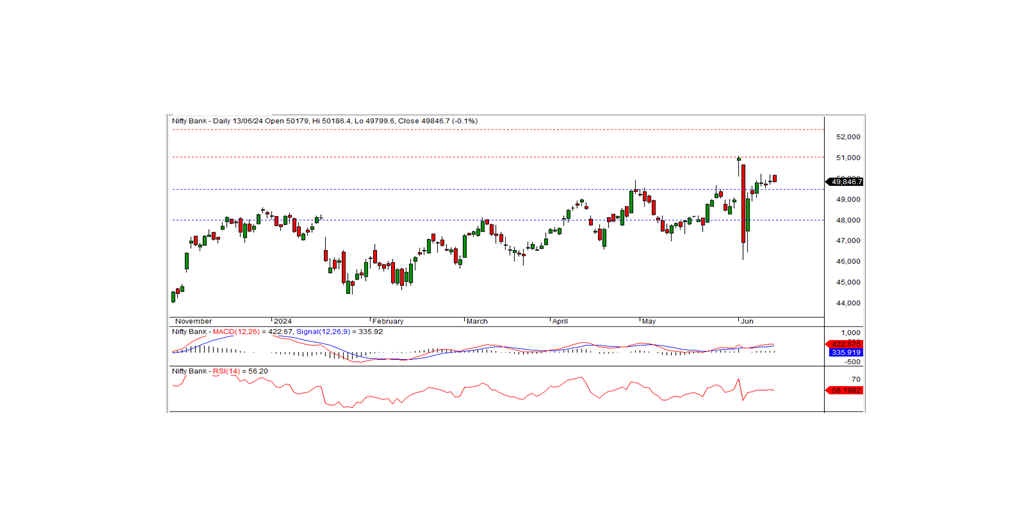
In the preceding trading session, Bank Nifty closed at 49,846.70, registering a loss of 48.40 points. Technically, the momentum indicators signal a positive trend, with the index remaining above its medium-term and short-term moving averages. However, the index formed a black candle on the daily chart and closed just below the previous day's close, indicating a possible consolidation phase.
On the downside, the index has short-term support at the 49,500 level. If it remains above this level, the consolidation is likely to continue for a few more days. The nearest intraday resistance is at the 50,000 level.
Intraday Levels: Support: 49,750, 49,550, 49,325 Resistance: 50,000, 50,250, 50,450 (15-Minute Charts)
Positional Trading: Short-term Support: 49,500-48,000 Resistance: 51,000-52,300