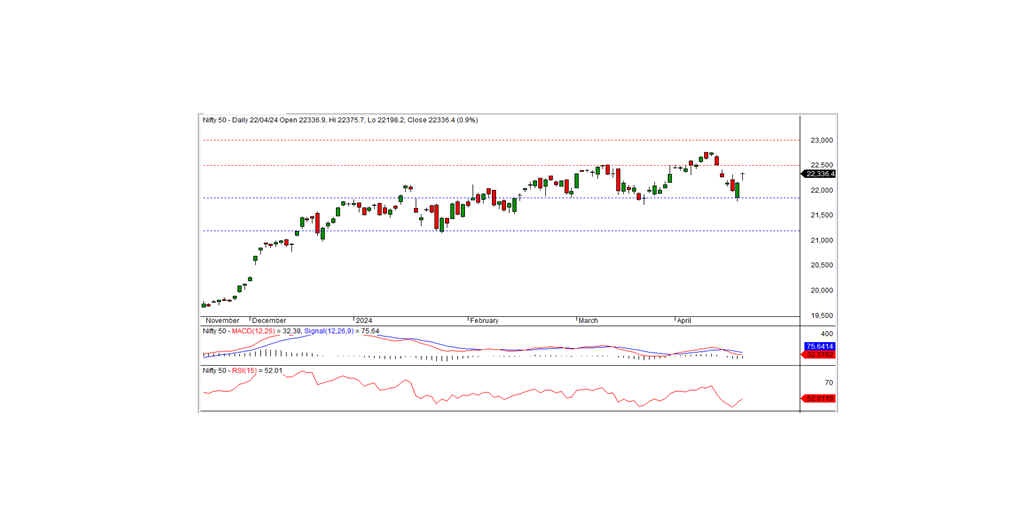
NIFTY TECHNICAL OUTLOOK
Based on Market Closing on Monday, April 22, 2024
In the latest trading session, the Nifty closed at 22336.40, marking a gain of 189.40 points or 0.86 percent. This positive trajectory will persist if the Nifty maintains trading above the intraday support level of 22300.
Initiating the session positively, the Nifty opened at 22336.90 and hit an intraday low of 22198.20 in the morning session. Subsequently, it steadily ascended, reaching an intraday high of 22375.70 before settling at 22336.40 at the close. Across all sectors, gains were observed, particularly notable in PSU banks, pharmaceuticals, automotive, and FMCG sectors. The market breadth was encouraging, with 1756 stocks registering gains, 664 experiencing declines, and 175 remaining unchanged. Notable performers among the Nifty constituents were BPCL, TATACONSUM, EICHERMOT, and LT, while NTPC, HDFCBANK, JSWSTEEL, and INDUSINDBK were among the significant losers.
From a technical perspective, the Nifty concluded above both short-term and medium-term moving averages. However, momentum indicators suggest a negative trend. The formation of a Doji candle on the daily chart, and a close above the previous day's candle high, indicates the potential continuation of the uptrend. On the downside, the index finds intraday support at 22300. Sustaining trading above this level could maintain positive momentum. The subsequent short-term resistance is anticipated around the 22500 mark.
Intraday Levels: Support - 22300, 22200, 22100 Resistance - 22400, 22500, 22600 (Based on 15-Minute Charts)
Positional Trading: Short-term Support - 21850-21200 Resistance - 22500-23000
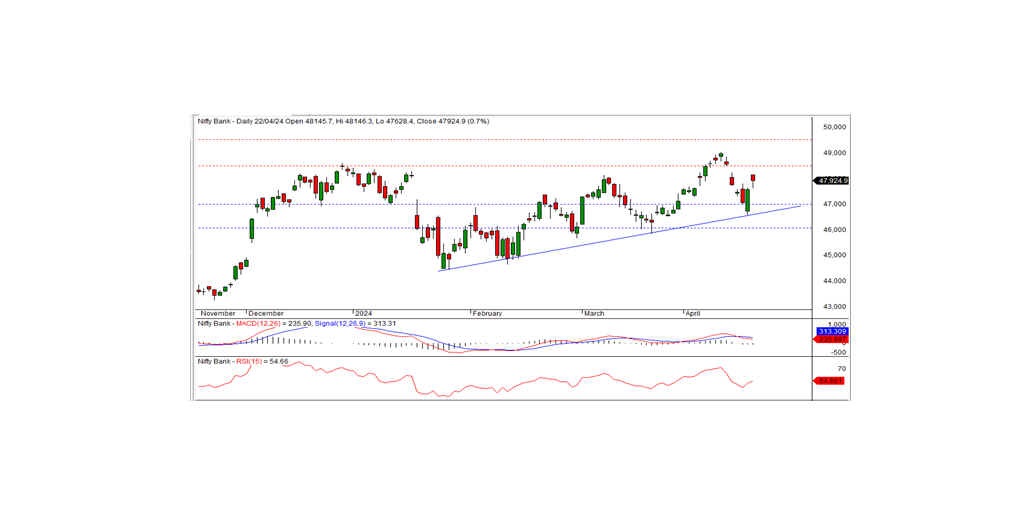
BANK NIFTY OUTLOOK
In the previous trading session, Bank Nifty concluded at 47924.90, marking an increase of 350.75 points. Technically, momentum indicators suggest a neutral trend, yet the index closed above its short-term moving averages. The index formed a black candle on the daily chart, but closed above the prior day's candle high, signaling the possibility to continue the bullish momentum. This positive trajectory will likely continue if the price stays above the intraday support level of 47750. The subsequent short-term resistance is anticipated at the 48500 mark.
For intraday traders, key support levels are identified at 47750, 47500, and 47300, while resistance levels can be observed at 48000, 48250, and 48500, as indicated by the 15-minute charts.
Positional traders are advised to monitor short-term support levels within the range of 47000-46000, with resistance expected between 48500 and 49500.