NIFTY TECHNICAL OUTLOOK
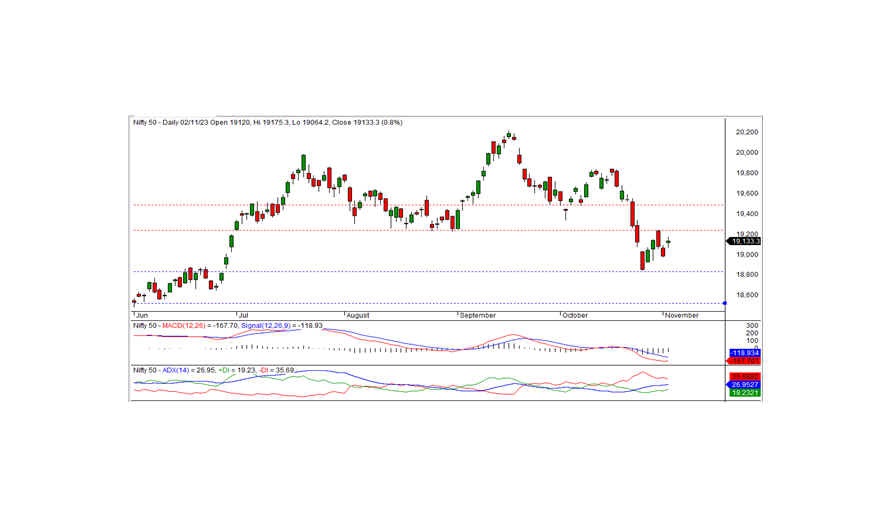
Based on the market closing on Thursday, November 02, 2023, the Nifty concluded at 19133.25, recording a gain of 144.10 points or 0.76 percent. The positive bias will persist as long as the index trades and holds above the 19000 level.
The Nifty began the day at 19120.00 with a favorable bias, reaching an intraday high of 19175.30 during the morning session. Subsequently, it dipped, touching the intraday low at 19064.20 before closing at 19133.25. All sectors closed on a positive note, with the reality, PSU banks, metal, and FMCG sectors leading the gains. Market breadth was positive, with 1517 stocks rising, 835 falling, and 130 remaining unchanged. Notable top gainers under the Nifty included BRITANNIA, HINDALCO, INDUSINDBK, and APOLLOHOSP, while the major losers were HEROMOTOCO, TECHM, BAJAJ-AUTO, and BAJFINANCE.
From a technical perspective, the Nifty remains below the short-term and medium-term moving averages. A negative bias is evident in momentum indicators. However, the index formed a small white candle on the daily chart, closing above the previous day's close, indicating a slightly positive bias. Over recent trading sessions, the Nifty has been consolidating within a range of 18837-19233, with the last closing near the upper bound of the trading range. A close above 19233 could turn the short-term trend bullish, while failure to do so may result in further consolidation within the trading range.
Intraday Levels: Support - 19100 - 19050 - 18985 Resistance - 19175 - 19233 - 19300 (15 Minute Charts)
For Positional Traders: Short-Term Support Levels - 18800 - 18500 Resistance - 19233 - 19500

BANK NIFTY
In the previous trading session, Bank Nifty closed at 43017.20, marking a gain of 316.25 points. From a technical standpoint, momentum indicators suggest a bearish bias, and the index continues to trade below the long-term moving averages.
However, on the daily chart, the index formed a Doji candle and closed above the previous day's closing level. This pattern indicates a positive bias. On the downside, the index has short-term support at 42800, with resistance at 43500. To establish a bullish trend, the index needs to close above this level. If it remains below the 43500 level, consolidation may persist for a few more days.
For intraday traders, notable support levels include 43000, 42,800, and 42,600, while resistance levels can be identified at 43265, 43,450, and 43,500, as indicated by the 15-minute charts.
Positional traders should monitor short-term support levels at 42,800-42,000, with resistance within the range of 43,500 to 44,000.

