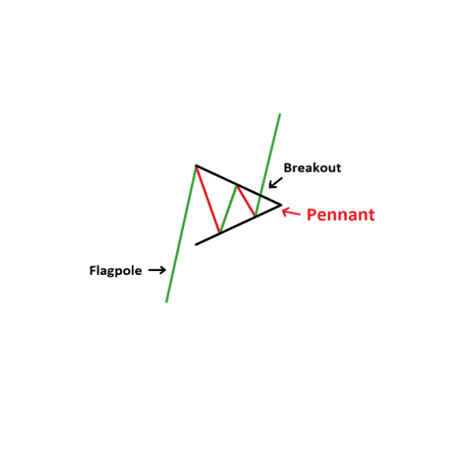
The Pennant or Flags pattern
The Pennant or Flags pattern is a technical analysis pattern that is used by traders to identify possible continuation or reversal of a trend in a financial market. It is a short-term pattern that indicates a pause in the current trend before the market resumes its previous direction.
The pattern is formed by a short-term price movement in a stock, commodity, or currency, where the price moves in a tight range, forming a triangular shape resembling a flag or pennant. The pattern is created when the price movement is followed by a sharp increase in volume, indicating strong momentum.
The importance of the Pennant or Flags pattern lies in its ability to signal the continuation of the current trend or a potential reversal of the trend. A bullish Pennant or Flag pattern indicates that the uptrend is likely to continue, while a bearish Pennant or Flag pattern suggests that the downtrend is likely to continue.
Traders can use this pattern to identify potential entry and exit points in a trade. In a bullish Pennant or Flag pattern, traders may choose to buy the stock when the price breaks out of the pattern, indicating a continuation of the uptrend. In a bearish Pennant or Flag pattern, traders may choose to short sell the stock when the price breaks out of the pattern, indicating a continuation of the downtrend.
It's important to note that like any other technical analysis pattern, the Pennant or Flags pattern is not foolproof and can result in false signals. Traders should always use other technical indicators and fundamental analyses to confirm