NIFTY TECHNICAL UPDATE
As of the market close on Monday, January 01, 2024
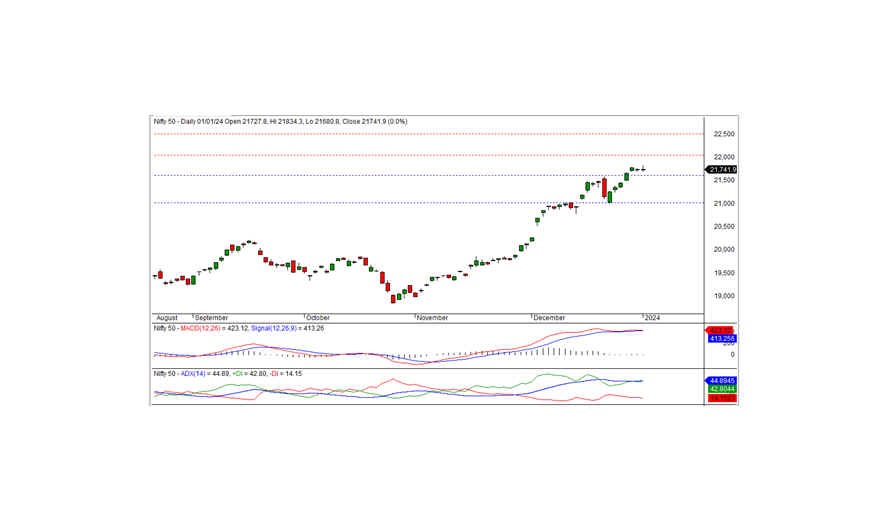
The Nifty concluded the trading session at 21741.90, recording a modest gain of 10.50 points or 0.05 percent. Notably, the Nifty encountered resistance within the 21800-835 range, and surpassing this zone is crucial for resuming the bullish trend.
Opening at 21727.80 in a bearish tone, the index gradually ascended, reaching a record high of 21834.30. However, the momentum could not be sustained, leading to a sharp decline during the closing session. The intraday low touched 21680.80, ultimately settling at 21741.90. The standout performers in sectors were media, PSU banks, FMCG, and IT, whereas financial services, auto, and banks experienced significant losses. The market breadth displayed positivity, with 1552 stocks rising, 826 falling, and 128 remaining unchanged.
Top gainers under the Nifty included NESTLEIND, ADANIENT, ADANI PORTS, and TECHM, while major losers comprised EICHERMOT, BHARTIARTL, M&M, and BAJAJ-AUTO.
From a technical perspective, the Nifty maintains a position above both short-term and long-term moving averages. Momentum indicators affirm a robust positive trend. The daily chart reveals a small white candle, closing just above the preceding day's close, indicating the potential for consolidation. On the upside, intraday resistance is observed at 21800-835 levels. A breach of this level could signal a resumption of the positive trend, otherwise, consolidation below this level may persist for a few days. The nearest short-term support lies at 21600 levels.
Intraday Support Levels: 21675-21600-21530 Resistance Levels: 21770-21835-21900 (15 Minute Charts)
For positional traders, short-term support is maintained at 21600-21000, with resistance at 22000-22500. Monitoring these levels will provide insights into potential market movements in the coming sessions.

BANK NIFTY UPDATE
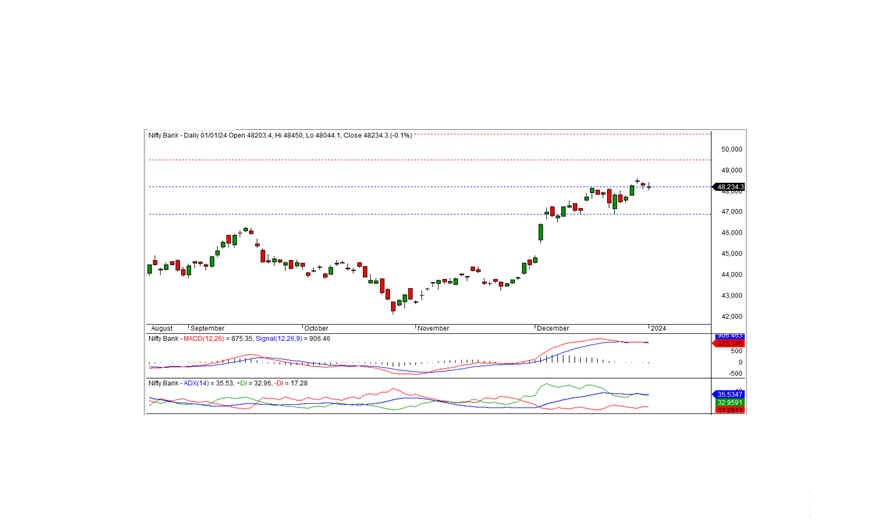
In the previous trading session, Bank Nifty concluded at 48234.30, marking a decrease of -57.95 points. From a technical standpoint, momentum indicators signal a positive trend, and the index remains positioned above the medium-term and long-term moving averages. However, the daily chart reveals the formation of a Doji candle, closing below the prior day's close, suggesting a slightly negative trend. On the downside, the index finds short-term support at 48200, and a potential continuation of the negative trend may occur if the index breaches this level. The nearest intraday resistance is identified at the 48400 level.
For intraday traders, support levels stand at 48200, 48000, and 47800, while resistance levels are observed at 48400, 48600, and 48800, as indicated by the 15-minute charts.
Positional traders are advised to keep a watch on short-term support levels at 48200-47000, with resistance noted at 49500-50700. Monitoring these levels will provide valuable insights into potential market movements in the coming sessions.

