NIFTY TECHNICAL OUTLOOK
Based on the Market Closing on Friday, January 12, 2024
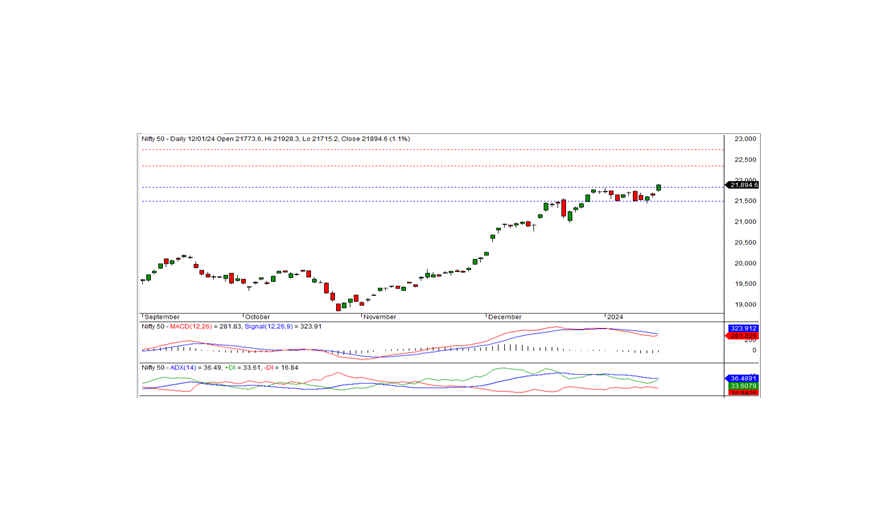
In the recent trading session, the Nifty closed a record high at 21894.55, marking a gain of 247.35 points or 1.14 percent. The upward momentum is anticipated to endure in the coming days, provided that the Nifty sustains levels above 21835.
The trading day commenced with a positive bias as the Nifty opened at 21773.60 and maintained this trajectory throughout the session, achieving a record high of 21928.30 before settling at 21894.55. Noteworthy sector gainers included IT, banks, FMCG, and metal, while media, auto, and pharma witnessed declines. The market breadth remained positive, with 1257 stocks advancing, 1137 declining, and 120 unchanged. Among Nifty components, INFY, ONGC, TECHM, and LTIM emerged as the top gainers, while CIPLA, APOLLOHOSP, ULTRACEMCO, and BAJAJFINSV incurred losses.
From a technical standpoint, the Nifty maintains its position above its short-term moving averages, and momentum indicators signal a positive trend. The daily chart displays a white candle closing near the all-time high, hinting at the potential continuation of the bullish trend. The nearest short-term support is situated at the 21835 level, with intraday resistance at 21930. A breach of the 21930 level would signal the continuation of the bullish trend, with the subsequent short-term resistance at 22350.
Intraday Support Levels: 21850-21800-21725
Resistance Levels: 21930-22000-22075 (15-Minute Charts)
For positional traders, short-term support levels persist at 21835-21500, with resistance at 22350-22750.

BANK NIFTY
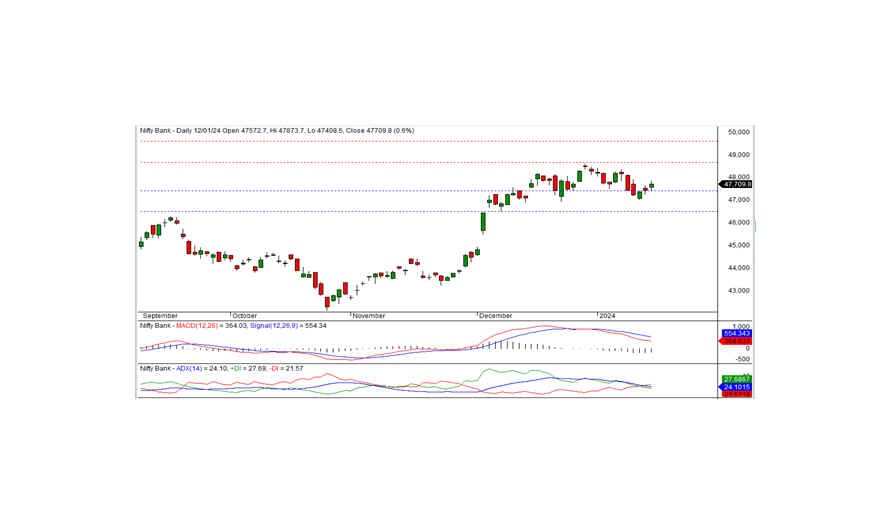
In the latest trading session, Bank Nifty concluded at 47709.80, marking a gain of 271.45 points. From a technical standpoint, momentum indicators signal a negative trend, and the index remains below the short-term moving averages. However, on the daily chart, the index formed a white candle and closed above the previous day's close. On the upside, the index faces intraday resistance at the 47850 level. If the index surpasses this level, the positive trend may continue in the upcoming days. The nearest short-term support is identified at 47400 levels.
For intraday traders, support levels are observed at 47640, 47460, and 47300, while resistance levels are noted at 47850, 48050, and 48250 according to the 15-minute charts.
Positional traders are advised to monitor short-term support levels at 47400-46500, with resistance at 48650-49700.

