Nifty Technical Outlook
Based on Market Closing on Monday, December 02, 2024
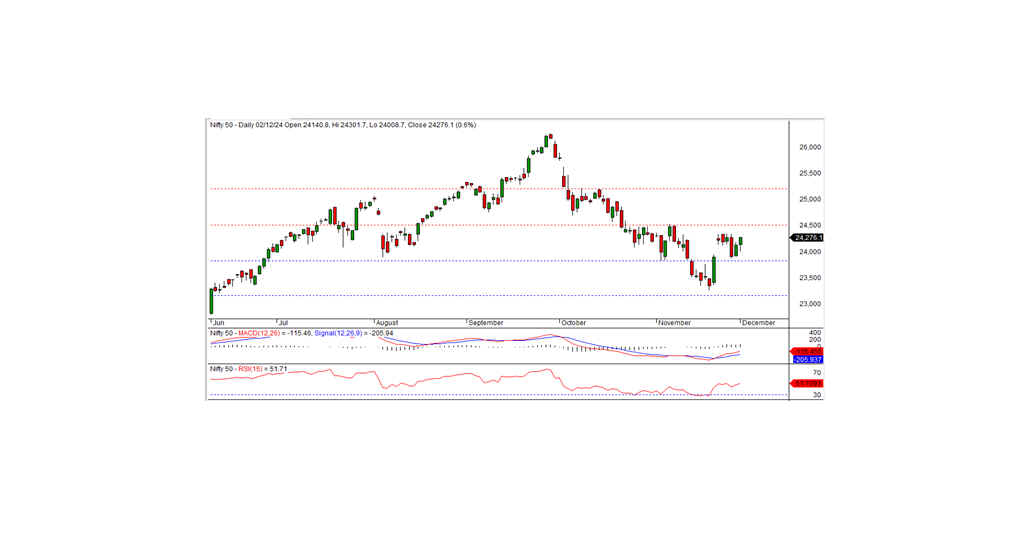
The Nifty closed at 24,276.05 in the last session, gaining 144.95 points or 0.61%. The bullish momentum is expected to continue if the index surpasses the intraday resistance level of 24,350.
In the previous session, the Nifty opened positively at 24,140.80. After touching an intraday low of 24,008.70, the index moved upward, reaching a high of 24,301.70 before closing at 24,276.05. Most sectors, except PSU banks and FMCG, ended with a positive bias. Realty, metals, media, and auto were the top-performing sectors. Market breadth was strong, with 1,727 stocks advancing, 948 declining, and 109 remaining unchanged. The top gainers in the Nifty were ULTRACEMCO, APOLLOHOSP, GRASIM, and SHRIRAMFIN, while HDFCLIFE, CIPLA, NTPC, and SBILIFE were the major losers.
From a technical perspective, momentum indicators confirm a positive trend, and the Nifty remains above its short-term moving averages. The index formed a white candle on the daily chart and closed above the previous day's bullish Harami pattern, signaling a resumption of bullish momentum.
The Nifty is showing strong bullish momentum, supported by positive market breadth and favorable technical patterns. A breakout above the 24,350 resistance level could sustain the uptrend, with the next target at 24,500. Traders should monitor key levels closely for confirmation of continued upward movement or signs of a pullback.
Intraday Levels: Support: 24,235, 24,135, 24,025 Resistance: 24,350, 24,450-24,550 (15-minute charts)
Positional Levels: Support: 23,800 - 23,150 Resistance: 24,500 - 25,200

Bank Nifty Technical Outlook
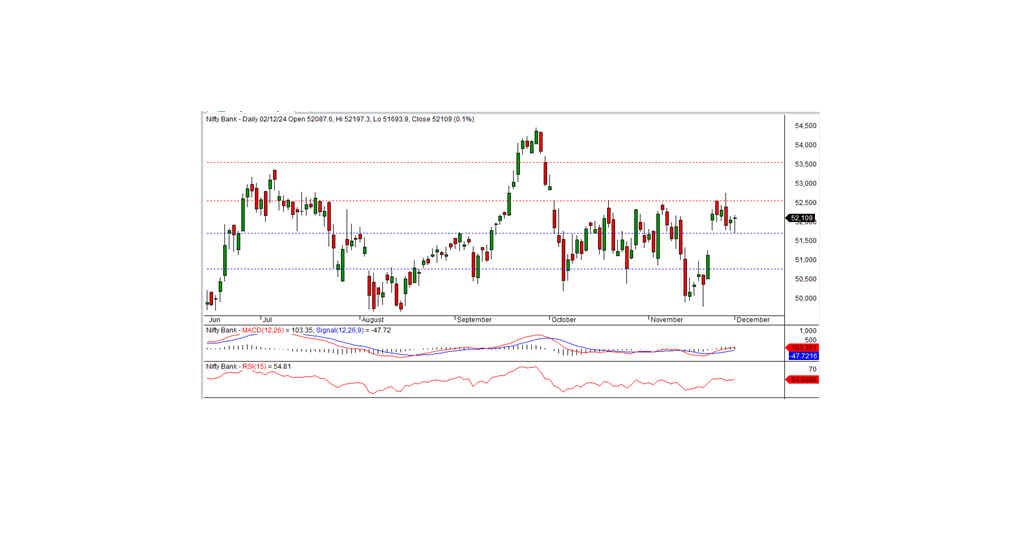
In the previous session, Bank Nifty closed at 52,109.00, gaining 53.40 points. Momentum indicators point to a positive trend, with the index staying above its short-term and long-term moving averages. Additionally, a small white candle formed on the daily chart, closing above the prior day’s level, signaling a positive bias.
Recently, the index has been trading within a narrow range. On the downside, it has short-term support at 51,700, while resistance is seen at 52,500. A breakout from this range is crucial for the next significant move. Considering the broader positive market sentiment, an upward breakout appears more likely. A breach above 52,500 could signal a continuation of bullish momentum, while a fall below 51,700 may lead to a short-term pullback. Traders should focus on these key levels for informed decision-making.
Intraday Levels (15-Minute Charts): Support: 51,800, 51,500, 51,200 Resistance: 52,130, 52,400, 52,700
Positional Levels: Support: 51,000 - 49,600 Resistance: 52,500 - 53,500

