Nifty Technical Outlook
Based on Market Closing on Wednesday, November 13, 2024
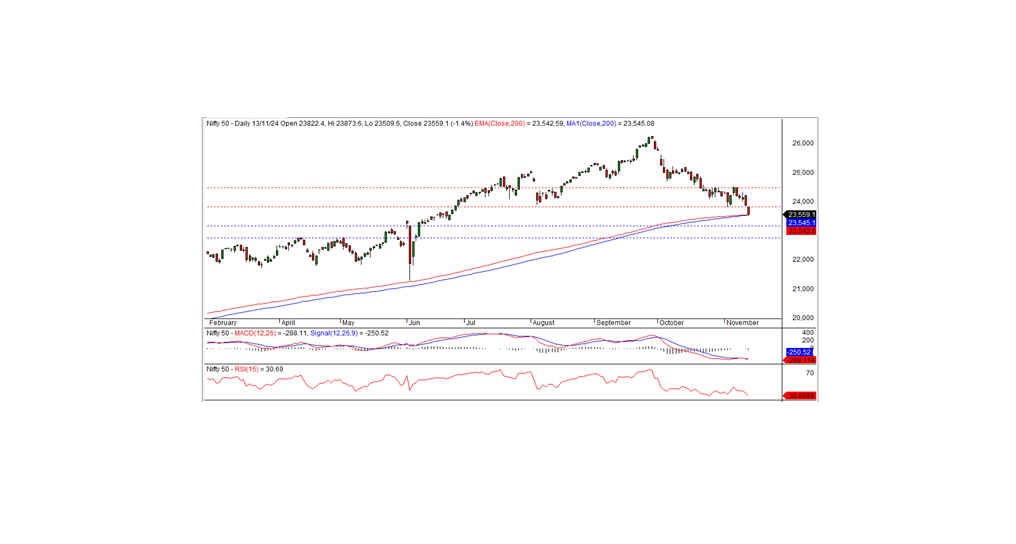
In the latest trading session, the Nifty closed at 23,559.05, declining by 324.40 points, or 1.36%. The 200-day moving average, currently at 23,545, serves as the immediate support level. Should the index fall below this level, the downtrend is likely to persist in the days ahead.
Nifty opened negatively at 23,822.40 and continued to decline throughout the session, hitting an intraday low of 23,509.60 before settling at 23,559.05. All sector indexes closed in the red, with real estate, PSU banks, metal, and auto sectors as the major laggards. Market breadth was notably weak, with 297 stocks advancing, 2,399 declining, and 81 remaining unchanged. Among the top gainers in the Nifty were BRITANNIA, NTPC, TATAMOTORS, and HINDUNILVR, while HEROMOTOCO, HINDALCO, TATASTEEL, and M&M led the losses.
Technically, momentum indicators point to a negative trend, with the Nifty remaining below its short-term and medium-term moving averages. The formation of a long black candle on the daily chart, closing near the session low, suggests sustained bearish momentum. The index’s 200-day moving average at 23,545 acts as immediate support; if breached, further downside could follow. Below this, short-term support lies at 23,150. On the upside, short-term resistance is at 23,800, a level that would need to be surpassed for any potential recovery.
Intraday Levels Support: 23,500, 23,400, 23,300 Resistance: 23,600, 23,700–23,800 (15-Minute Charts)
Positional Trading Levels Support: 23,150–22,750 Resistance: 23,800–24,500

Bank Nifty Technical Outlook
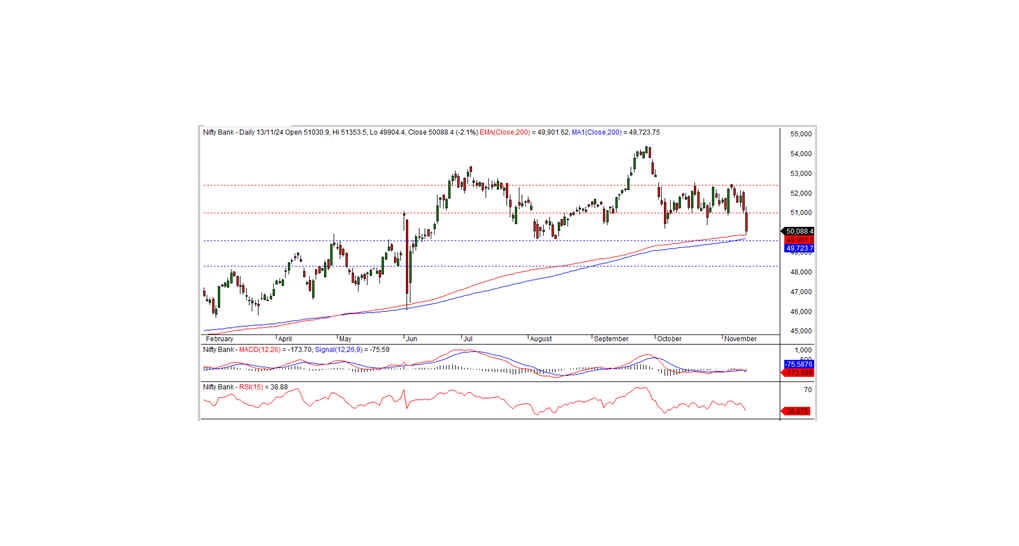
In the previous session, Bank Nifty closed at 50,088.35, down by 1,069.45 points, reflecting notable bearish momentum. Technically, indicators suggest a continuation of the negative trend, with the index trading below both its short-term and medium-term moving averages. The formation of a long black candle on the daily chart, closing near the session low, reinforces the bearish outlook.
On the downside, Bank Nifty has multiple supports in the 49,900–49,600 range. Notably, the 200-day EMA and SMA are positioned at 49,901 and 49,723, respectively, with additional short-term support around 49,600. If the index breaks and sustains below these levels, further downside is likely. Conversely, a pullback rally may be possible if these support levels hold. The nearest intraday resistance is at 50,350.
Intraday Levels Support: 49,750, 49,500, 49,350 Resistance: 50,350, 50,650, 51,000 (15-Minute Charts)
Positional Levels Support: 49,600–48,300 Resistance: 51,000–52,400

