NIFTY TECHNICAL OUTLOOK
Based on Market Closing on Friday, July 12, 2024
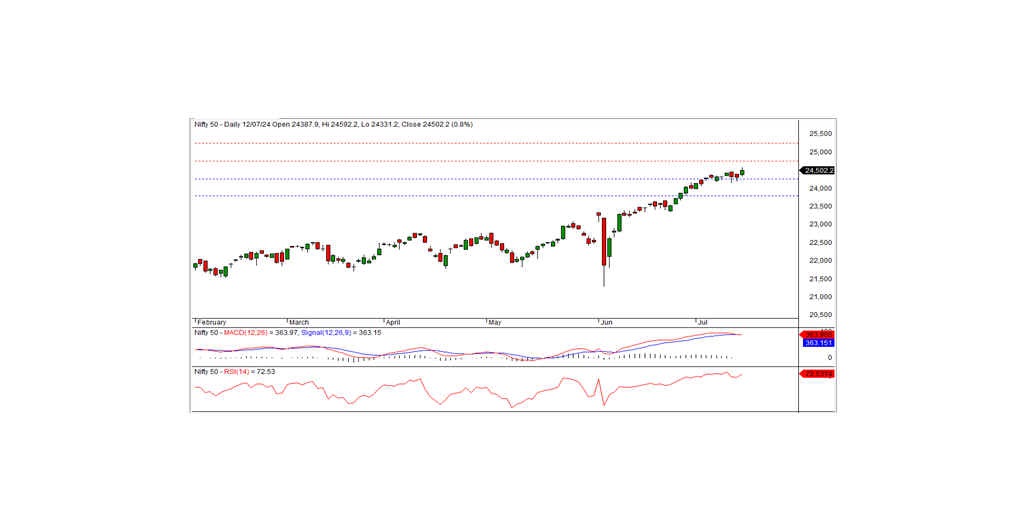
In the last trading session, the Nifty closed at 24,502.15, up 186.20 points or 0.77%. The positive trend will continue if the index remains above the intraday support level of 24,475.
The Nifty opened at 24,387.90 on a positive bias, then hit an intraday low of 24,331.20 in the morning trade. The index subsequently rose to a record high of 24,592.20 before closing at 24,502.15. The major sector gainers were IT, media, FMCG, and private banks, while the laggards included realty, PSU banks, auto, and metals. The market breadth was negative, with 970 stocks rising, 1,556 falling, and 114 remaining unchanged. The top gainers in the Nifty index were TCS, WIPRO, INFY, and HCLTECH. Conversely, the major losers included MARUTI, DIVISLAB, COALINDIA, and ASIANPAINT.
From a technical standpoint, momentum indicators signal a positive trend. The Nifty remains above both its long-term and short-term moving averages. Additionally, the index formed a white candle on the daily chart and closed at a record high, indicating a bullish trend. The nearest intraday resistance is at the 24,600 level. On the lower side, the index has short-term support at 24,475. If the index remains above this level, it may test the next short-term resistance at 24,750 in the coming days.
Intraday Levels Support: 24,475, 24,400, 24,325 Resistance: 24,600, 24,675-24,750 (15-Minute Charts)
Positional Trading Short-term support: 24,250-23,800 Resistance: 24,750-25,250
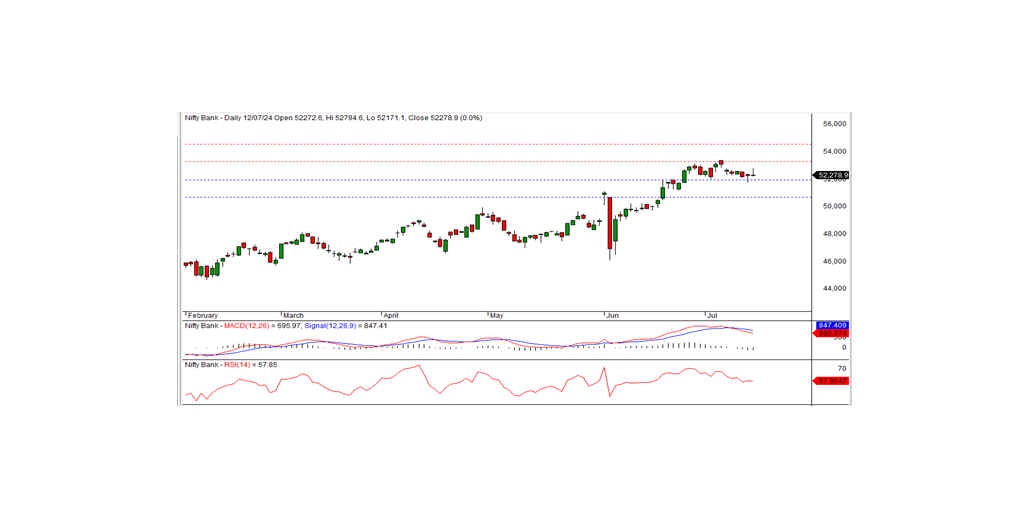
BANK NIFTY TECHNICAL OUTLOOK
In the preceding trading session, Bank Nifty closed at 52,278.90, registering a gain of 8.25 points. Technically, the momentum indicators signal a negative trend, and the index remains below the short-term moving averages. The index formed a Doji candle on the daily chart and closed just above the previous day's close, indicating the possibility of continued consolidation.
On the higher side, the index has intraday resistance at the 52,350 level. If the index moves above this level, the positive trend can continue. Otherwise, the index may consolidate above the support level of 51,900 for a few more days.
Intraday Levels - Support: 52,100, 51,900, 51,700 Resistance: 52,350, 52,600, 52,850 (15-Minute Charts)
Positional Trading- Short-term support: 51,900-50,650 Resistance: 53,250-54,500