
NIFTY TECHNICAL OUTLOOK
Based on Market Closing on Wednesday, March 06, 2024
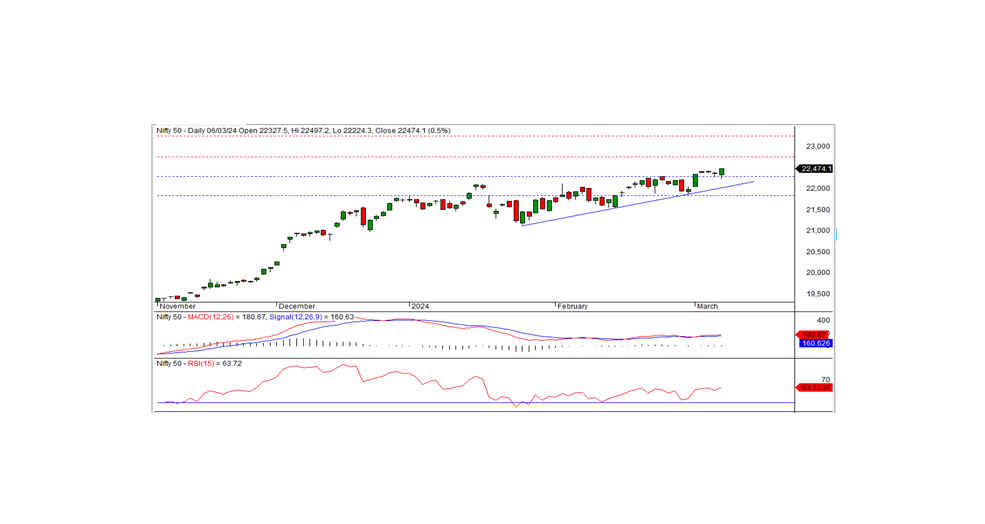
In the last trading session, the Nifty closed at a record high of 22,474.05, up by 117.75 points or 0.53 percent. The positive trend may persist today if the Nifty trades and sustains above the 22,430 level.
During the session, the Nifty opened at the 22,327.50 level on a negative note and reached an intraday low of 22,224.30 in the morning trade. Subsequently, the index gradually climbed and tested the record high of 22,497.20 before closing at 22,474.05. The banking, IT, pharma, and financial services sectors were the biggest gainers, while the losers were observed in media, realty, and metal sectors. The market breadth was negative, with 432 stocks rising, 2004 falling, and 115 remaining unchanged. Notable gainers included BAJAJ-AUTO, KOTAKBANK, AXISBANK, and BHARTIARTL, while major losers included ADANIENT, ULTRACEMCO, NTPC, and ONGC.
From a technical standpoint, the Nifty remains above both short-term and long-term moving averages. Momentum indicators signal a positive trend; moreover, the index formed a white candle on the daily chart and closed at a record high. In the last trading session, the index closed above the highs of the last three days. Further upside movement can be expected if the index trades and sustains above the 22,430 level. On the upside, the nearest short-term resistance is at the 22,750 levels.
Intraday Levels: Support - 22,430, 22,365, 22,300 Resistance - 22,500, 22,575, 22,650 (15-Minute Charts)
Positional Trading: Short-term support - 22,300-21,835 Resistance - 22,750- 23,250.
BANK NIFTY
In the preceding trading session, Bank Nifty closed at 47,965.40, registering a gain of 384.40 points. Technically, momentum indicators signal a positive trend, with the index remaining above both short-term and long-term moving averages. Moreover, the index formed a white candle on the daily chart and closed near the day's high, indicating the continuation of the positive trend. On the lower side, the index has intraday support at 47,900, while resistance is observed at 48,150. If the index moves above the 48,150 level, the positive trend can likely continue in the coming days. The next short-term resistance is anticipated at 48,500 levels.
For intraday traders, the support levels are at 47,900, 47,700, and 47,450, while resistance levels can be identified at 48,150, 48,400, and 48,600 as indicated by the 15-minute charts.
Positional traders should monitor short-term support levels at 47,000-45,300, with resistance at 48,500-50,000.
