NIFTY TECHNICAL OUTLOOK
Based on Market Closing on Thursday, September 12, 2024
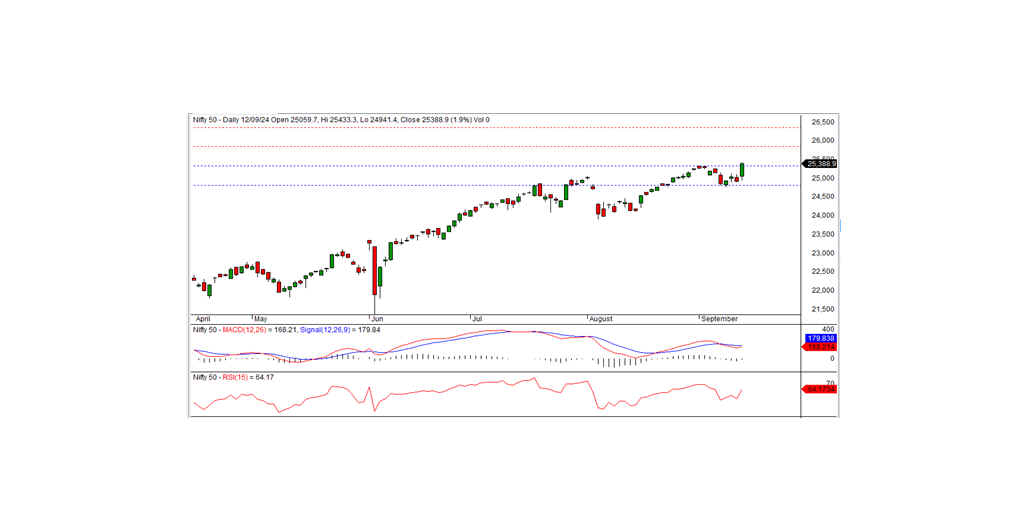
In the last trading session, Nifty reached a record high, closing at 25,388.90, gaining 470.45 points, or 1.89%. The positive momentum will continue if the index surpasses the intraday resistance level of 25,435.
The session began on a positive note, with Nifty opening at 25,059.70. The index initially dipped to an intraday low of 24,941.40 during morning trade but surged in the afternoon, hitting a record high of 25,433.30 before closing at 25,388.90. All sectors closed with gains, with metals, auto, PSU banks, and IT leading the pack. Market breadth was positive, with 1,522 stocks advancing, 1,069 declining, and 112 remaining unchanged. Notably, all Nifty index stocks ended in positive territory, with HINDALCO, BHARTIARTL, NTPC, and SHRIRAMFIN among the top gainers.
Technically, momentum indicators point to a continued positive trend, as Nifty closed above its short-term moving averages. The formation of a long white candle on the daily chart, coupled with the record close, suggests a bullish outlook. Immediate resistance is seen at 25,435, while support lies at 25,300. Should the index break through the resistance, the bullish trend may extend. Otherwise, a brief consolidation below this level could occur.
Intraday Levels Support: 25,300, 25,200, 25,100 Resistance: 25,435, 25,525–25,600 (15-Minute Charts)
Positional Trading Levels Short-term Support: 25,350 – 24,800 Resistance: 25,850 – 26,350
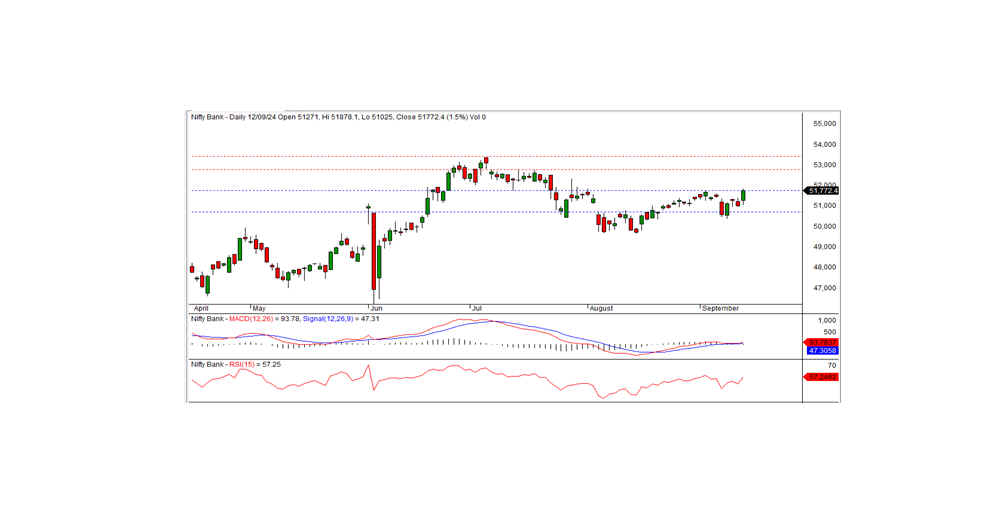
BANK NIFTY TECHNICAL OUTLOOK
In the previous trading session, Bank Nifty closed at 51,772.40, gaining 762.40 points. Technically, momentum indicators suggest a bullish trend, as the index closed above its short-term moving averages. Additionally, the formation of a white candle on the daily chart, with the close just above the key resistance level of 51,750, signals continued positive momentum.
On the upside, Bank Nifty faces intraday resistance at 51,850. The technical indicators suggest that Bank Nifty remains in a strong bullish trend. If the index breaks above the resistance at 51,850, the momentum could drive the index higher in the short term. However, traders should be cautious of consolidation if the index fails to sustain this level.
For intraday traders, key support levels are at 51,600, 51,400, and 51,200, while resistance is seen at 51,850, 52,075, and 52,300, based on the 15-minute charts.
Positional traders should monitor short-term support at 51,750–50,700, with resistance at 52,775–53400