
NIFTY TECHNICAL ANALYSIS
As of the Market Closing on Tuesday, March 12, 2024
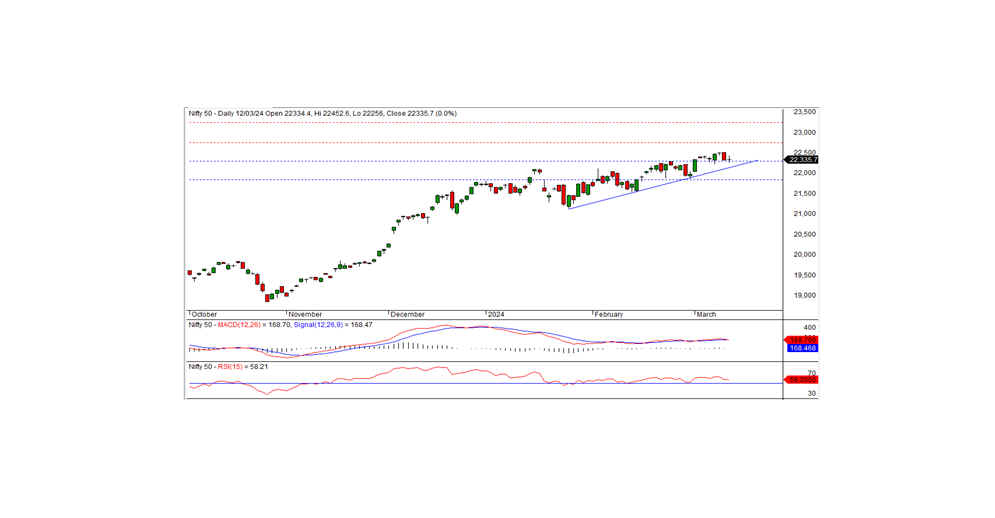
In the latest trading session, the Nifty concluded at 22335.70, marking a modest increase of 3.05 points or 0.01 percent. A potential pullback rally may materialize if the Nifty maintains its position above 22300.
The session began with the Nifty opening at 22334.30, displaying a neutral stance, but reached an intraday high of 22452.60 in the morning trade. Then, the index experienced a sharp decline, touching an intraday low of 22256.00, ultimately closing at 22335.70. Except for IT, financial services, and private banks, all sectors ended on a negative note. The real estate, public banks, media, and metal were the biggest lowers. The market breadth depicted a negative sentiment, with 306 stocks rising, 2170 falling, and 81 remaining unchanged. Among the noteworthy gainers were HDFCBANK, TCS, LTIM, and MARUTI, while major losers included ADANIENT, CIPLA, GRASIM, and ADANIPORTS.
From a technical perspective, the Nifty remains positioned above both short-term and long-term moving averages, with momentum indicators signaling a positive trend. However, the formation of a Doji candle on the daily chart, closing just above the previous day's close, indicates uncertainty among market participants. The index has short-term support at the 22300 level, and a potential downside movement might occur if the index falls below this level. Otherwise, a pullback rally can be anticipated from the support area. On the higher side, the nearest intraday resistance is at 22385 levels.
Intraday Levels: Support - 22300, 22225, 22150 Resistance - 22385, 22450, 22525 (15-Minute Charts)
Positional Trading: Short-term support - 22300-21835 Resistance - 22750-23250.
BANK NIFTY
In the preceding trading session, Bank Nifty closed at 47282.40 registering a loss of -45.45 points. Technically, the momentum indicators signal a positive trend. And the index remains above the short-term and long-term moving averages. However, the index formed a black candle on the daily chart and closed below the previous day's close. On the lower side, the index has short-term support at the 47200 level. The downtrend can continue today if the index drops below this level. The nearest intraday resistance is at the 47450 level. For a pullback rally, this level must be exceeded.
For intraday traders, the support levels are at 47200, 47000, and 46800, while resistance levels can be identified at 47450, 47800, and 48000 as indicated by the 15-minute charts.
Positional traders should monitor short-term support levels at 47000-45300, with resistance at 48500 -50000
