NIFTY TECHNICAL ANALYSIS
Based on Market Closing on Tuesday, February 20, 2024
The Nifty concluded the recent trading session at 22196.95, marking a gain of 74.70 points or 0.34 percent. If the Nifty maintains its position above the 22125 level, it could potentially test the resistance at 22500 in the forthcoming sessions.
The Nifty commenced trading at 22090.20 then hit the intraday low of 22045.80, gradually climbing to a record high of 22215.60, finally settling at 22196.95. Notably, sectors such as media, financial services, banks, and realty witnessed significant gains, whereas IT, auto, metal, and pharma sectors experienced declines. Market breadth was negative, with 1162 stocks rising, 1275 falling, and 103 remaining unchanged. Among the top gainers under the Nifty were POWERGRID, HDFCBANK, AXISBANK, and NTPC, while major losers included HEROMOTOCO, COALINDIA, BAJAJ-AUTO, and EICHERMOT.
From a technical perspective, the Nifty remains positioned above both short-term and long-term moving averages, with momentum indicators signaling a positive trend. Furthermore, the formation of a white candle on the daily chart and closing near the record high indicates bullish sentiment. Short-term support for the Nifty is observed at 22125, and if the index continues trading above this level, the bullish trend could persist in the days ahead. The subsequent short-term resistance is anticipated at 22500.
Intraday Levels (15-Minute Charts): Support: 22185, 22100, 22025 Resistance: 22265, 22350, 22450
For positional traders, short-term support levels are maintained at 22125 and 21500, while resistance levels are identified at 22500 and 23000.

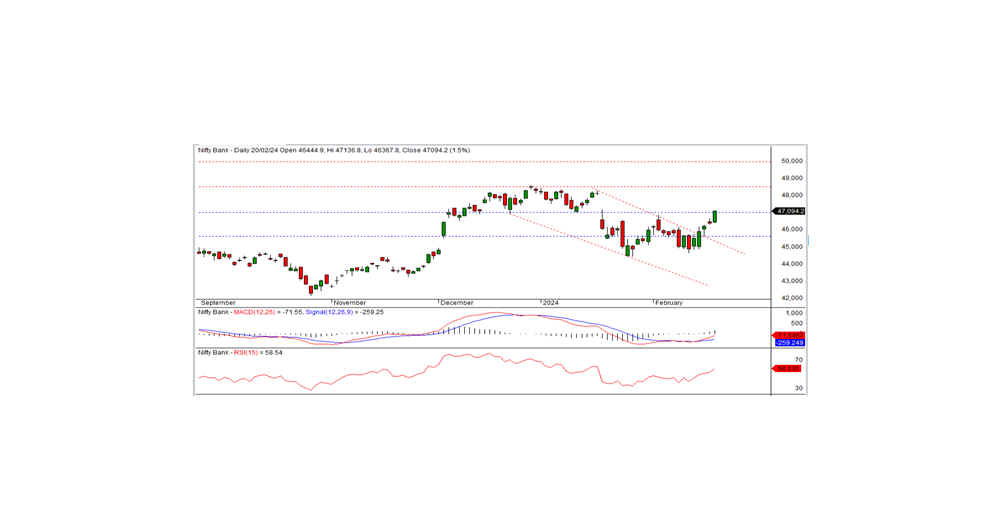
BANK NIFTY OUTLOOK
In the previous trading session, Bank Nifty concluded at 47094.20, marking a notable gain of 558.70 points. Technically, momentum indicators continue to signal a positive trend, with the index maintaining positions above both short-term and long-term moving averages. Notably, the index formed a long white candle on the daily chart, closing above the critical resistance level of 47000. These factors collectively suggest that bullish momentum persists. Should the index remain above the 47000 mark, the bullish trend is likely to extend in the forthcoming sessions. The subsequent short-term resistance is anticipated at the 48500 level.
For intraday traders, support levels are identified at 47000, 46750, and 46500, while resistance levels can be found at 47250, 47500, and 47750, as highlighted by the 15-minute charts.
Positional traders are advised to monitor short-term support levels at 47000-45600, with resistance levels at 48500 - 50000.