NIFTY TECHNICAL OUTLOOK
Based on Market Closing on Wednesday, August 07, 2024
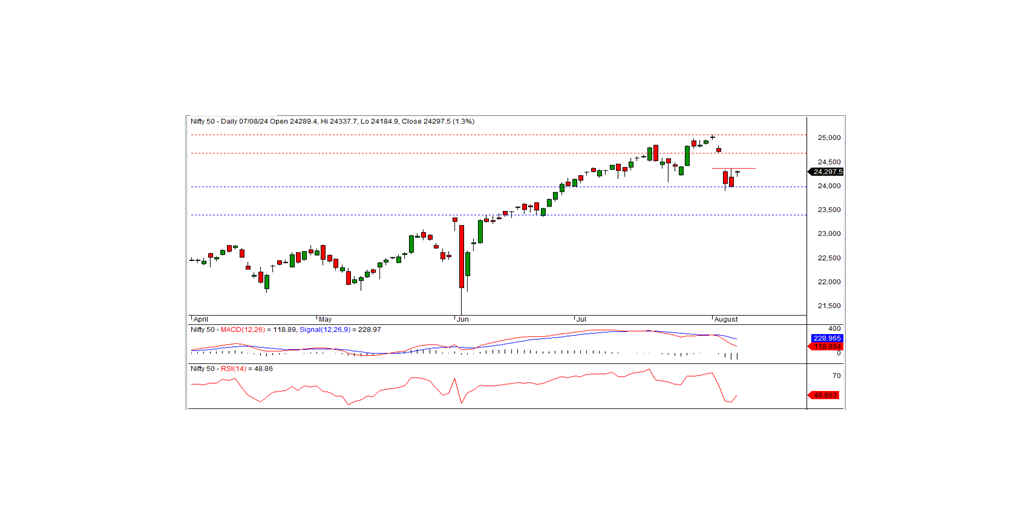
In the last trading session, the Nifty closed at 24297.50, up 304.95 points or 1.27 percent. The uptrend will continue if the index moves above the intraday resistance level of 24400.
In the last trading session, the Nifty opened on a positive bias at 24289.40 and this positive momentum continued throughout the session the index tested the intraday high of 24337 before closing at 24297.50. All the sectors were closed on a positive bias. The biggest sector gainers were metal, media, pharma, and realty. The market breadth was positive with 2005 stocks rising, 566 falling, and 92 remaining unchanged. The top gainers in the Nifty index were ONGC, COALINDIA, ADANIENT, and ADANIPORTS, while the major losers included INDUSINDBK, EICHERMOT, TECHM, and BRITANNIA.
From a technical standpoint, the momentum indicators signal a negative trend and the Nifty remains below the short-term moving averages. However, the index formed a small white candle on the daily chart and closed above the previous day's close. This pattern indicates a slightly positive bias for the index. On the lower side, the index has intraday support at the 24200 level, while the resistance is at 24400. If the index moves above the 24400 level the index may fill the gap area that formed a few days back. Otherwise, the index may continue the consolidation for a few more days.
Intraday Levels: Support - 24200, 24000, 23850 Resistance - 24400, 24600-24800(15-Minute Charts)
Positional Trading: Short-term support - 24000-23400 Resistance - 24685- 25080.
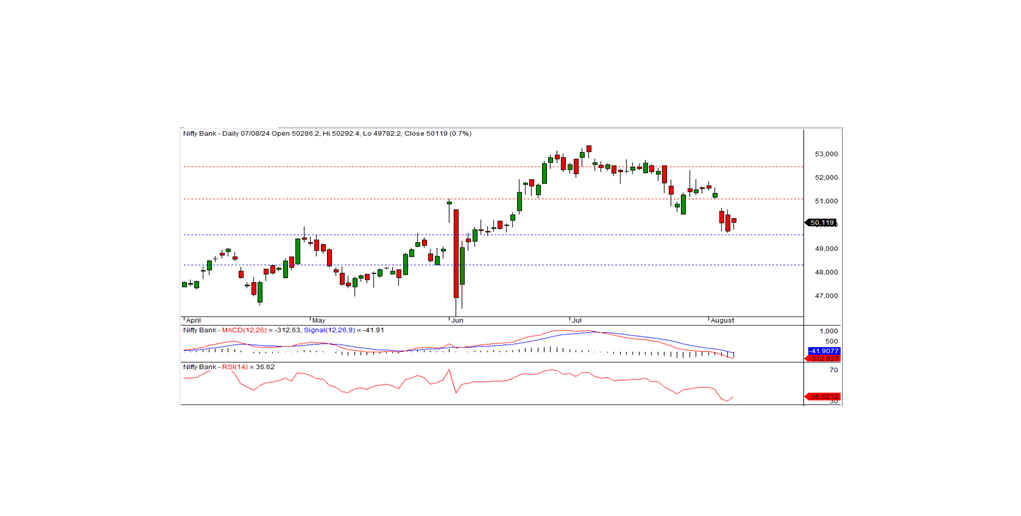
BANK NIFTY
In the preceding trading session, Bank Nifty closed at 50119.00 registering a gain of 370.70 points. From a technical point of view, the momentum indicators suggest a downward trend and the index remains below its short-term moving averages. Moreover, the index formed a black candle on the daily chart but closed inside the previous day's candle. This pattern indicates the possibility of a consolidation. On the lower side, the index has intraday support at the 50000 level, while the resistance is at 50300. If the index moves above the resistance level, the positive trend will likely continue. Otherwise, the index may consolidate 50300 for a few days. On the lower side, the short-term support remains at 49600 levels
For intraday traders, the support levels are at 50000, 49800, and 49600, while resistance levels can be identified at 50300,50600, and 50800 as indicated by the 15-minute charts.
Positional traders should monitor short-term support levels at 49600-48300, with resistance at 51000 -52450.