NIFTY TECHNICAL OUTLOOK
Based on Market Closing on Monday, February 03, 2025
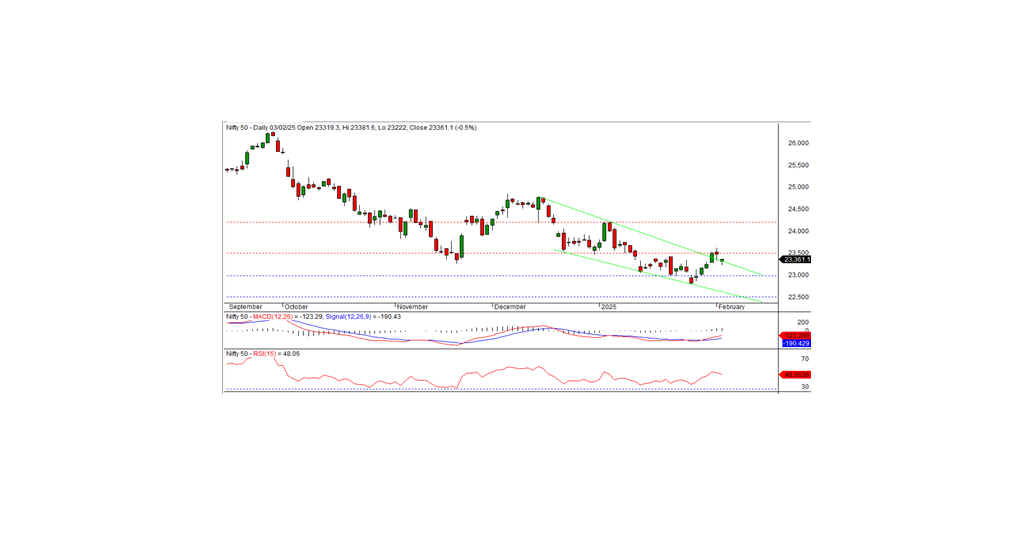
The Nifty closed at 23,361.05, down 121.10 points (-0.52%). A positive trend could emerge if the index moves above the previous session's high of 23,381.
The Nifty opened lower at 23,319.30, hit an intraday low of 23,222 in early trade, and later recovered to test the intraday high of 23,381.60 before closing at 23,361.05. Sectorally, IT, Pharma, and Auto were the top gainers, while Metal, FMCG, Banks, and Media underperformed. Market breadth remained weak, with 665 stocks advancing, 2,026 declining, and 166 unchanged. The top gainers included BAJFINANCE, M&M, WIPRO, and SHRIRAMFIN, while LT, ONGC, TATACONSUM, and COALINDIA led the declines.
Technical Outlook: The index remains above its short-term moving averages, and momentum indicators signal a positive bias. A small white candle formed on the daily chart, but the close was below the previous session's level. The lower shadow on the candle suggests buying interest near the support zone. A sustained move above 23,381 could indicate further gains, while intraday support is seen at 23,340. Short-term resistance is at 23,500, and a breakout above this level could confirm a strong bullish trend
Intraday Levels: Support: 23,340, 23,250, 23,150 Resistance: 23,450, 23,550-23,650
Positional Trading: Support: 23,000-22,500 Resistance: 23,500-24,200
While Nifty remains in a consolidation phase, a breakout above 23,500 could confirm renewed bullish momentum. Traders should watch key resistance levels for further direction

Bank Nifty Technical Outlook
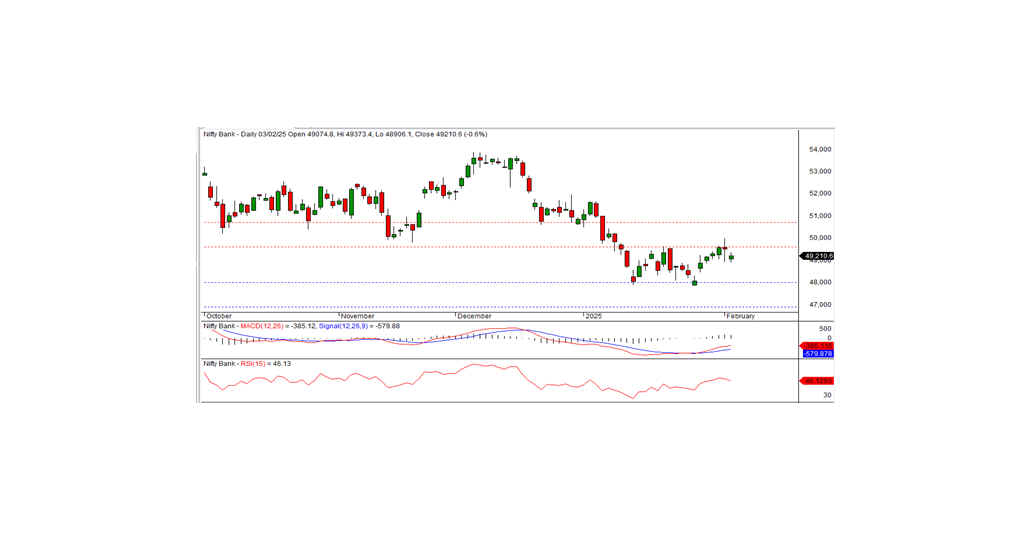
In the previous session, Bank Nifty closed at 49,210.55, registering a loss of 296.40 points. Despite the decline, technical indicators suggest a positive trend, with the index remaining above its short-term moving averages. On the daily chart, a white candle was formed, but the index closed below the previous day's level, indicating a slight negative bias. The immediate intraday support is at 49,100, while resistance stands at 49,400. A breakout beyond either of these levels will determine the index's direction for the session. For a bullish trend to resume, the index must close above 49,600.
For intraday traders, key support levels are 49,100, 48,850, and 48,600, while resistance levels are 49,400, 49,660, and 50,000.
Positional traders should monitor support at 48,000–47,000, with resistance at 49,600–50,700.

