NIFTY TECHNICAL OUTLOOK
Based on Market Closing on Thursday, August 29, 2024
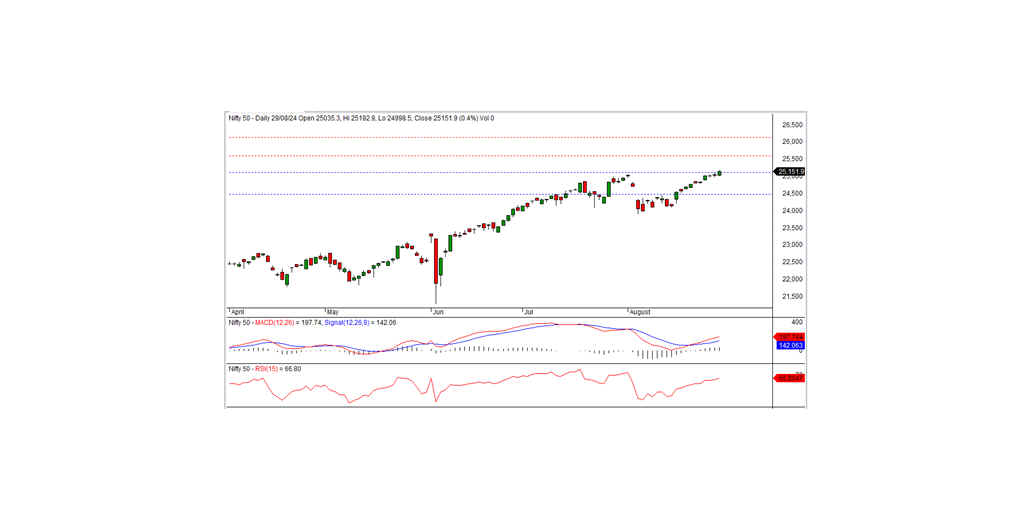
In the last trading session, the Nifty closed at 25,151.95, gaining 99.60 points or 0.40%. The positive trend is expected to continue if the Nifty remains above the support level of 25,100.
The Nifty opened with a negative bias at 25,035.30 and experienced volatility, testing a record high of 25,192.90 before closing at 25,151.95. Sector-wise, FMCG, auto, IT, and financial services led the gains, while metal, pharma, media, and realty were the major losers. The market breadth was negative, with 773 stocks advancing, 1,778 declining, and 135 remaining unchanged. The top gainers in the Nifty index were TATAMOTORS, BAJAJFINSV, BPCL, and BAJFINANCE, while the major losers included GRASIM, M&M, JSWSTEEL, and DRREDDY.
From a technical perspective, momentum indicators suggest a bullish trend, as the Nifty continues to trade above both its short-term and long-term moving averages. Additionally, the index formed a white candle on the daily chart, closing above the prior resistance level of 25,100. Should the index remain above this level, the bullish momentum is expected to continue in the coming days, with the nearest intraday resistance situated at 25,200.
Intraday Levels: Support: 25,120, 25,025, 24,950 Resistance: 25,200, 25,275–25,350 (15-Minute Charts)
Positional Trading: Short-term Support: 25,100–24,475 Resistance: 25,600–26,150
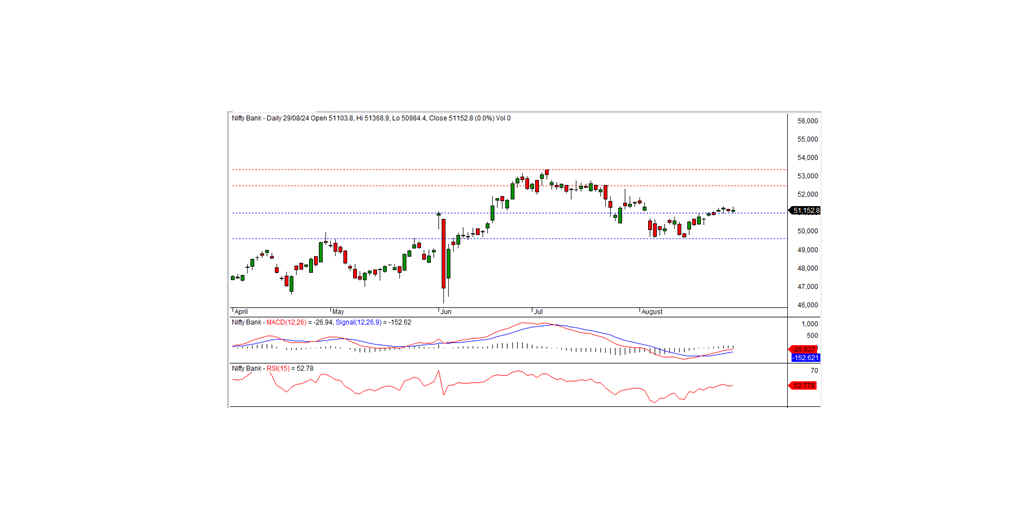
BANK NIFTY
In the previous trading session, Bank Nifty closed at 51,152.75, gaining 8.90 points. Technically, momentum indicators suggest a positive trend, with the index holding above its short-term and long-term moving averages. A small white candle formed on the daily chart, closing slightly above the previous day's close. Over the last few sessions, the index has been trading within a narrow range, indicating a potential consolidation phase.
On the upside, the index faces intraday resistance at 51,400. If it surpasses this level, the bullish trend could resume; otherwise, it may consolidate above the 51,000 level for a few days.
For intraday traders, support levels are at 51,000, 50,800, and 50,650, while resistance levels are at 51,250, 51,400, and 51,600, as indicated by the 15-minute charts.
Positional traders should watch short-term support at 51,000–49,600, with resistance at 52,500–53,400.