NIFTY TECHNICAL OUTLOOK
Based on Market Closing on Wednesday, August 21, 2024
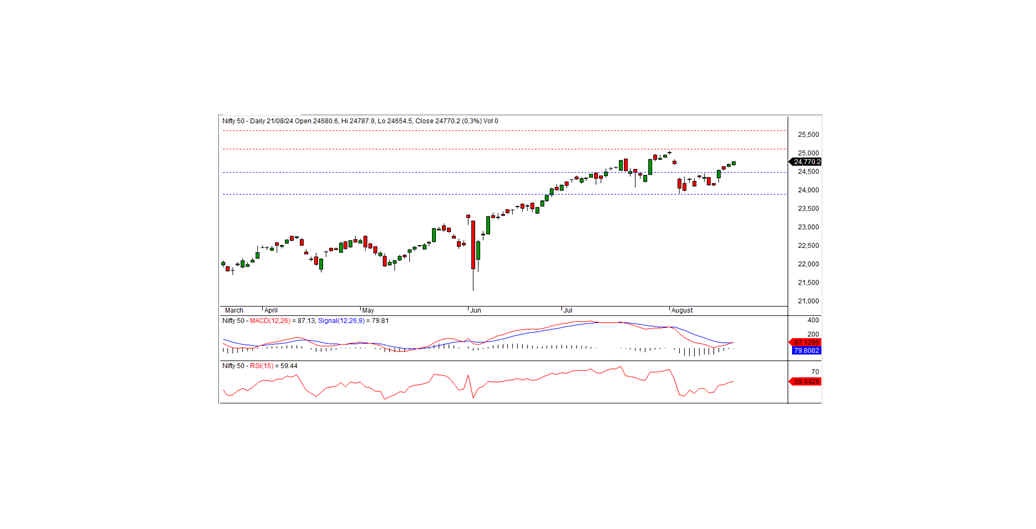
In the last trading session, the Nifty closed at 24,770.20, up 71.35 points or 0.29 percent. The positive trend is expected to continue if the Nifty remains above the intraday support at 24,750.
The session began with the Nifty opening on a negative bias at 24,680.60, but it gradually rose, testing an intraday high of 24,787.90 before closing at 24,770.20. The biggest sector gainers were FMCG, media, pharma, and metal, while realty, banks, financial services, and IT were the major losers. The market breadth was positive, with 1,698 stocks rising, 893 falling, and 87 remaining unchanged. The top gainers in the Nifty index were DIVISLAB, TITAN, SBILIFE, and CIPLA, while the major losers included TECHM, ULTRACEMCO, TATA STEEL, and POWERGRID.
Technically, momentum indicators signal a bullish trend, with the Nifty remaining above both short-term and long-term moving averages. Additionally, the index formed a white candle on the daily chart and closed above the previous day's close, suggesting the continuation of this upward trend. On the downside, the index has intraday support at the 24,750 level. If it sustains above this support, the bullish momentum is likely to continue in the coming days.
Intraday Levels: Support: 24,750, 24,660, 24,600 Resistance: 24,825, 24,900-24,975 (15-Minute Charts)
Positional Trading: Short-term Support: 24,475-23,900 Resistance: 25,100-25,600
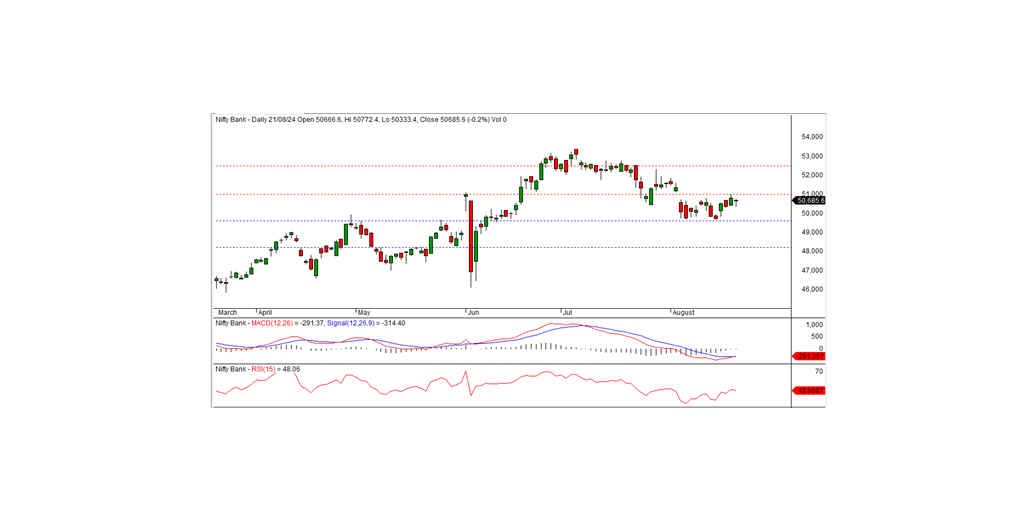
BANK NIFTY
In the previous trading session, Bank Nifty closed at 50,685.55, registering a loss of 117.60 points. From a technical perspective, momentum indicators suggest a positive trend, with the index remaining above its short-term and long-term moving averages. The index formed a Doji candle on the daily chart and closed within the range of the previous day's candle, indicating the possibility of consolidation. On the upside, the index has intraday resistance at the 50,700 level. A positive trend can be expected if the index trades and sustains above this level. The nearest intraday support is at 50,500. For the bullish trend to strengthen, the index needs to close above the 51,000 level.
Intraday Levels: Support: 50,500, 50,300, 50,100 Resistance: 50,700, 51,000, 51,200 (15-Minute Charts)
Positional Trading: Short-term Support: 49,600-48,200 Resistance: 51,000-52,500