NIFTY TECHNICAL OUTLOOK
Market Closing on Wednesday, October 23, 2024
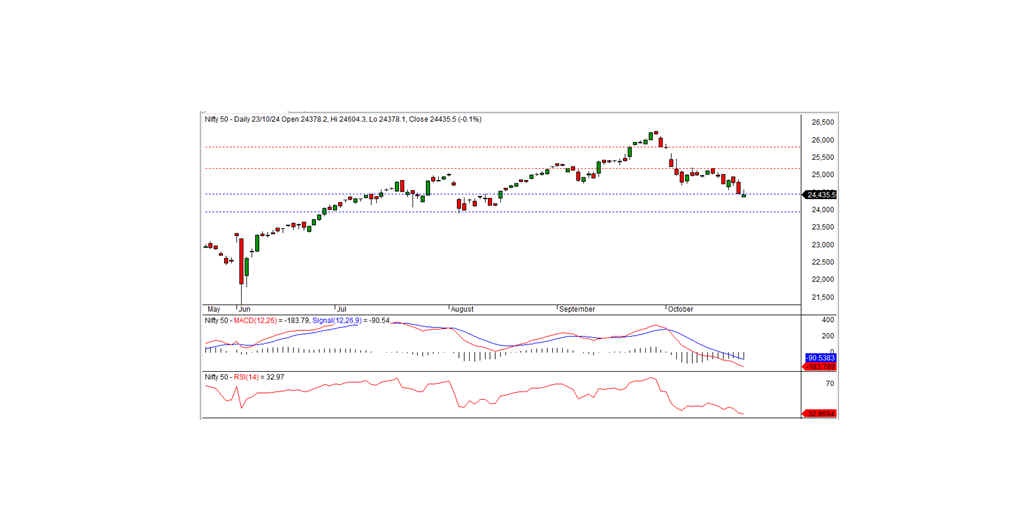
In the last trading session, the Nifty ended at 24,435.50, down by 36.60 points or 0.15%. The index remains under pressure and could continue its negative bias if it stays below the immediate support level of 24,450.
Nifty opened weak at 24,378.20 but recovered during the day, testing an intraday high of 24,604.30. However, afternoon selling pushed it lower, closing at 24,435.50. The IT, PSU banks, media, and financial services sectors outperformed, while pharma, auto, private banks, and metal sectors lagged. Market breadth was positive, with 1,451 stocks advancing, 1,200 declining, and 98 unchanged. The top gainers in the Nifty were Bajaj Finance, Tech Mahindra, Bajaj Auto, and Tata Consumer Products. Major losers included M&M, Sun Pharma, Power Grid, and NTPC.
From a technical perspective, momentum indicators continue to signal a negative trend, as the Nifty remains below its short- and medium-term moving averages. The index formed a small white candle on the daily chart and closed just below the key support level of 24,450, hinting at a possible continuation of the downtrend. A sustained move below this level could lead to further downside, with the next support at 24,000. On the upside, immediate intraday resistance is seen at 24,500.
However, momentum indicators suggest that the index is nearing oversold territory, with the RSI closing at 32.96 on the daily chart. Historically, Nifty has staged recoveries when RSI levels reach the 33-35 range. A pullback rally may be on the cards if the index holds within the 24,400-24,450 support zone.
Intraday Levels: Support: 24,400, 24,300, 24,200 Resistance: 24,500, 24,570-24,700 (15-Minute Charts)
Positional Trading Levels: Short-term support: 24,450-24,000 Resistance: 25,200-25,800

BANK NIFTY TECHNICAL OUTLOOK
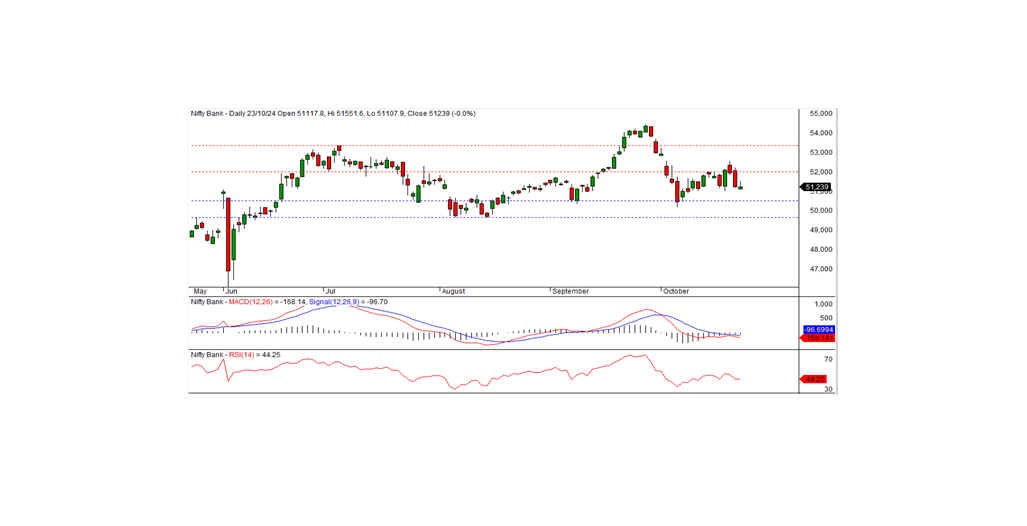
In the last trading session, Bank Nifty closed at 51,239, down by 18.15 points. Technically, momentum indicators suggest a bearish trend, with the index remaining below its short-term moving averages. A small white candle formed on the daily chart, but the index closed just under the previous day’s close, reinforcing a negative bias.
On the downside, the index has immediate intraday support at 51,130, while resistance is seen at 51,400. A break below the 51,130 level could extend the downtrend. For a shift to positive momentum, Bank Nifty needs to breach the 51,400 resistance level.
Intraday Levels (15-Minute Charts): Support: 51,130, 50,850, 50,600 Resistance: 51,400, 51,675, 51,900
Positional Trading Levels: Short-term support: 50,500–49,650 Resistance: 52,000–53,350

