NIFTY TECHNICAL OUTLOOK
Based on Market Closing on Tuesday, February 13, 2024
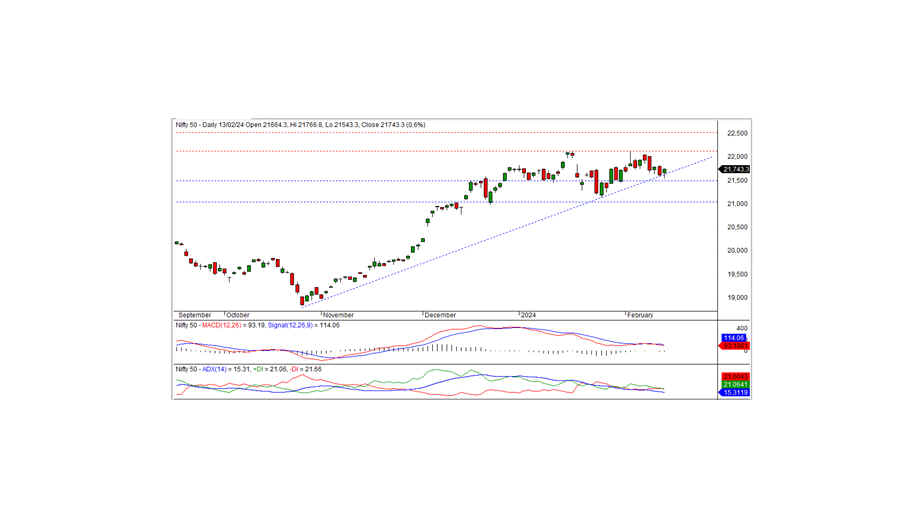
In the last trading session, the Nifty closed at 21743.25, marking a gain of 127.20 points or 0.59 percent. Notably, the Nifty encountered strong resistance in the 21750-21800 area.
The Nifty commenced the session with a positive bias, opening at 21664.30. It initially dipped to an intraday low of 21543.30 during morning trade but gradually ascended, reaching an intraday high of 21766.80 before settling at 21743.25. Most sectors closed with gains except for metal and media. Banking, financial services, IT, and pharma sectors exhibited significant gains. The market breadth leaned negative, with 1083 stocks rising, 1366 falling, and 80 remaining unchanged. Notable gainers under the Nifty included COAL INDIA, UPL, ICICIBANK, and AXISBANK, while major losers were HINDALCO, GRASIM, ULTRACEMCO, and DIVISLAB.
From a technical standpoint, the Nifty continues to stay beneath the short-term moving averages, with momentum indicators suggesting a negative trend. Nevertheless, the index formed a small white candle on the daily chart and concluded within the confines of the previous black candle. This formation implies the potential for consolidation. Notably, the index faces significant resistance within the 21750-21800 area, while support rests at 21500. It's anticipated that the index might undergo consolidation within the 21500-21800 trading range for the next few days. A breakout from either of these levels will likely determine the index's direction.
Intraday Support levels -21685-21625-21550 Resistance levels –21765-21830-21900(15 Minute Charts)
For positional traders, short-term support is pegged at 21500-21000, while resistance stands at 22125-22500.

BANK NIFTY
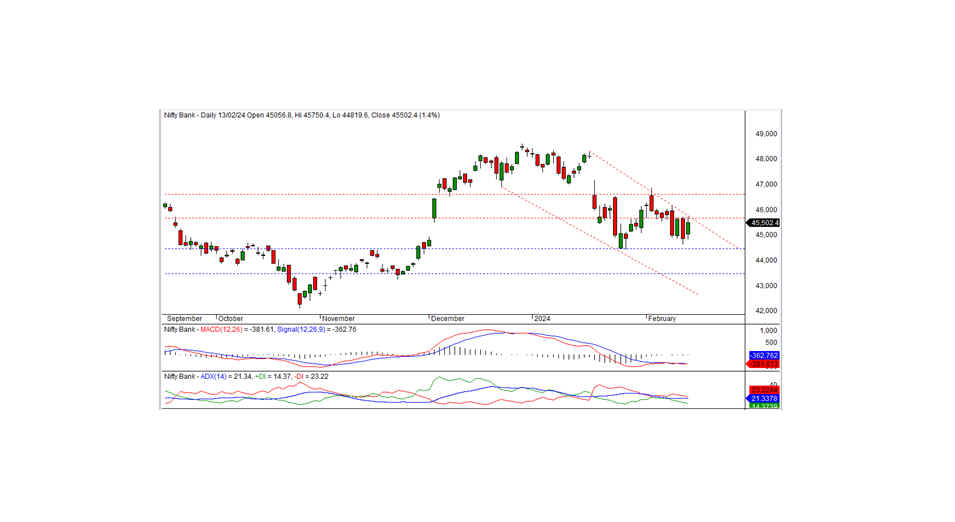
In the previous trading session, Bank Nifty closed at 45502.40, marking a gain of 620.15 points. Technically, momentum indicators suggest a negative trend, yet the Nifty closed above its short-term moving averages. Furthermore, the index formed a white candle on the daily chart and concluded above the previous day's close. The closest short-term resistance sits at the 45600 level. The index must close above this threshold for a bullish trend to continue. Failure to breach this level may prolong consolidation for several more days. The nearest support on the downside remains at 44450.
For intraday traders, support levels are identified at 45275, 45000, and 44730, while resistance levels are indicated at 45550, 45800, and 46000, as per the 15-minute charts.
Positional traders are advised to monitor short-term support levels at 44450-43500, with resistance at 45600-46600.

