NIFTY TECHNICAL OUTLOOK
Based on Market Closing on Wednesday, July 31, 2024
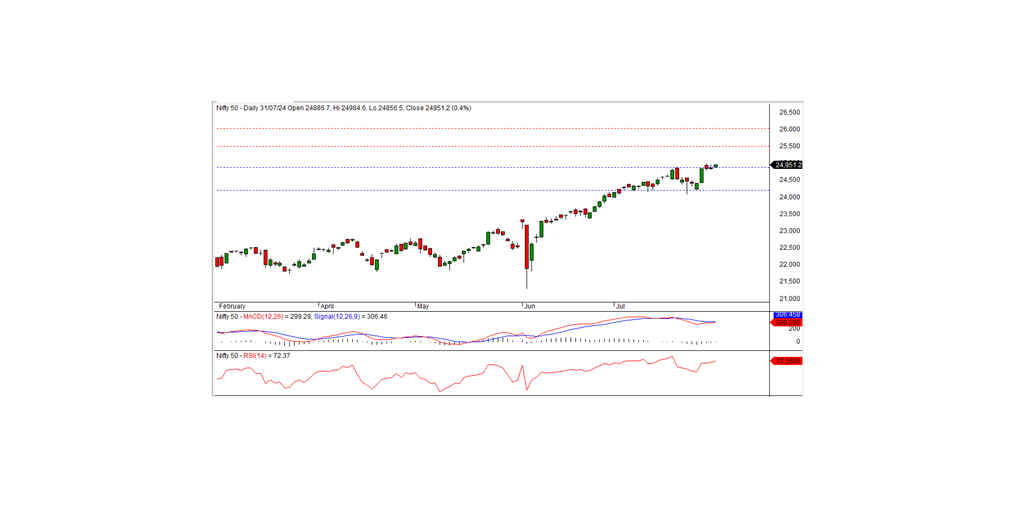
In the last trading session, the Nifty closed at 24,951.15, up 93.85 points or 0.38 percent. A sharp uptrend can be expected in the coming days if the Nifty remains above the short-term support level of 24,870.
The Nifty opened positively at 24,886.70, maintaining this momentum throughout the session, and tested the intraday high of 24,984.60 before closing at 24,951.15. The biggest sector gainers were metals, pharma, media, and FMCG, while the losers were PSU banks and realty. The market breadth was negative, with 1,255 stocks rising, 1,288 falling, and 108 remaining unchanged. The top gainers in the Nifty index were JSW Steel, Asian Paints, HDFC Life, and NTPC, while the major losers included Britannia, Dr. Reddy's, Grasim, and Reliance.
From a technical standpoint, the momentum indicators signal a positive trend, with the Nifty remaining above both the short-term and long-term moving averages. Additionally, the index formed a small white candle on the daily chart and closed above the previous day's close, suggesting a continuation of the bullish trend. The index has short-term support at the 24,870 level. If the index remains above this level, a sharp uptrend can be expected in the coming days. The nearest intraday resistance is at the 25,000 level.
Intraday Levels: Support: 24,900, 24,800, 24,700 Resistance: 25,000, 25,100-25,200 (15-Minute Charts)
Positional Trading: Short-term support: 24,870-24,200 Resistance: 25,500-26,000
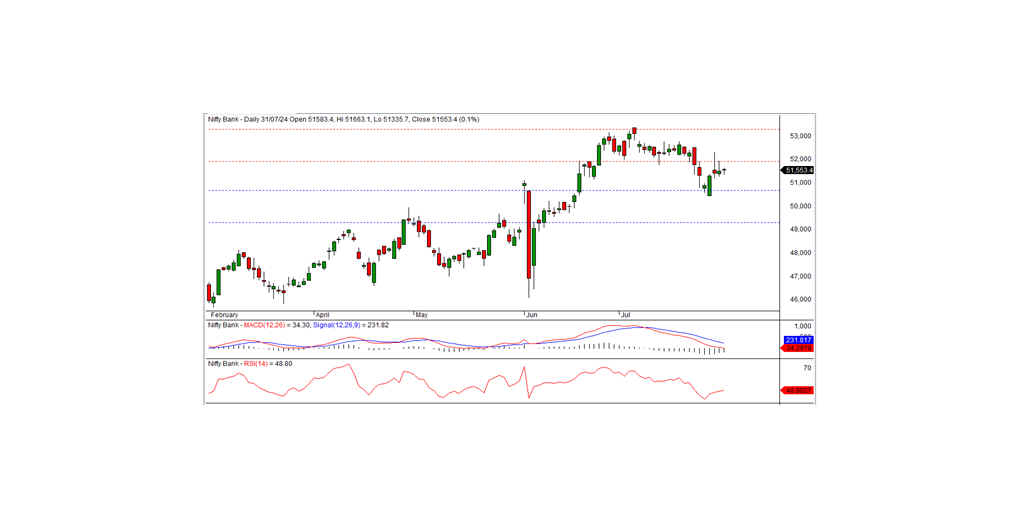
BANK NIFTY TECHNICAL OUTLOOK
In the preceding trading session, Bank Nifty closed at 51,553.40, registering a gain of 54.10 points. From a technical point of view, the momentum indicators suggest a downward trend. However, the index remains above its long-term moving averages. Additionally, the index closed above the previous day's close with a small white candle on the daily chart.
On the lower side, the index has intraday support at the 51,200 level. If the index remains above this level, bullish trends are likely to continue. The nearest intraday resistance is at the 51,600 level. For a strong bullish trend, the index needs to close above 51,900. Otherwise, the recent consolidation will continue for a few more days.
Intraday Levels: Support: 51,200, 50,900, 50,600 Resistance: 51,600, 51,950, 52,300 (15-Minute Charts)
Positional Trading: Short-term support: 50,650-49,300 Resistance: 51,900-53,250