NIFTY Technical Outlook
Based on Market Closing on Monday, July 22, 2024
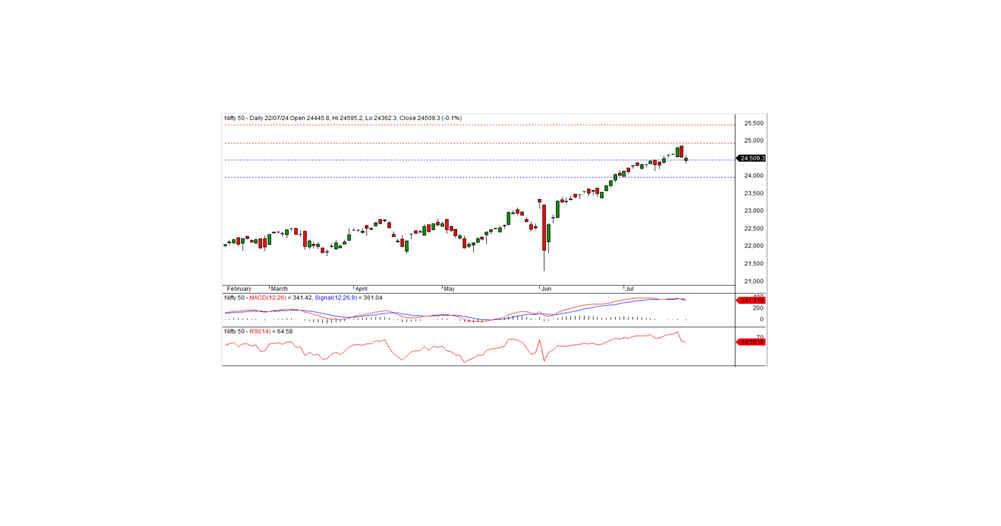
In the last trading session, the Nifty closed at 24,509.25, down 21.65 points or 0.09 percent. The downtrend is expected to continue if the index closes below the short-term support level of 24,500.
The session saw the Nifty opening at 24,445.80 with a negative bias, hitting an intraday low of 24,362.30 in the morning trade. The index then gradually rose, testing an intraday high of 24,595.20, before closing at 24,509.25. The auto, pharma, metal, and PSU bank sectors were the top gainers, while the realty, media, IT, and FMCG sectors were the losers. Market breadth was positive, with 1,416 stocks rising, 1,161 falling, and 66 remaining unchanged. The top gainers in the Nifty index included GRASIM, NTPC, ULTRACEMCO, and HDFCBANK, while the major losers were WIPRO, KOTAKBANK, RELIANCE, and ITC.
From a technical standpoint, momentum indicators signal a neutral trend. The Nifty remains above its long-term and short-term moving averages. The index formed a small white candle on the daily chart but closed below the previous day's close, indicating a negative bias. The nearest short-term support is at 24,500 levels; if the index closes below this level, the short-term trend may turn downward. Otherwise, a pullback rally can be expected from this support area. On the higher side, the nearest intraday resistance is at 24,600 levels.
Intraday Levels: Support: 24,500, 24,400, 24,300 Resistance: 24,600, 24,700-24,800 (15-Minute Charts)
Positional Trading: Short-term Support: 24,500-24,000 Resistance: 25,000-25,500
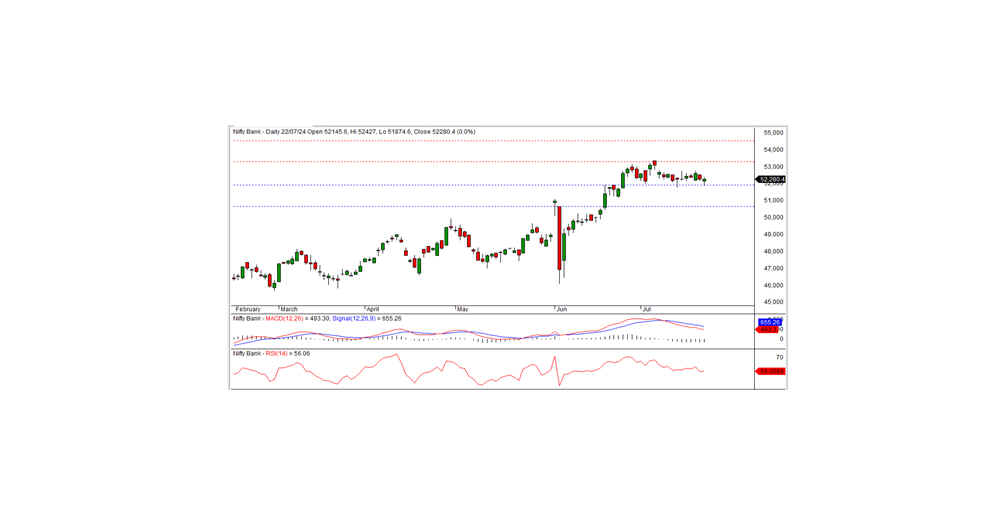
Bank Nifty
In the preceding trading session, Bank Nifty closed at 52,280.40, registering a gain of 14.80 points. Technically, momentum indicators signal a negative trend, and the index remains below its short-term moving averages. However, the index formed a small white candle on the daily chart and closed above the previous day's close, indicating a slightly positive bias.
On the lower side, intraday support is at the 52,200 level. A negative trend may develop if the index moves below this support. The nearest intraday resistance is at 52,400 levels. For a pullback rally, the index needs to move above this resistance level.
Intraday Levels: Support: 52,200, 52,000, 51,800 Resistance: 52,400, 52,600, 52,800 (15-Minute Charts)
Positional Trading: Short-term Support: 51,900-50,650 Resistance: 53,250-54,500