NIFTY TECHNICAL OUTLOOK
Based on Market Closing on Thursday, July 11, 2024
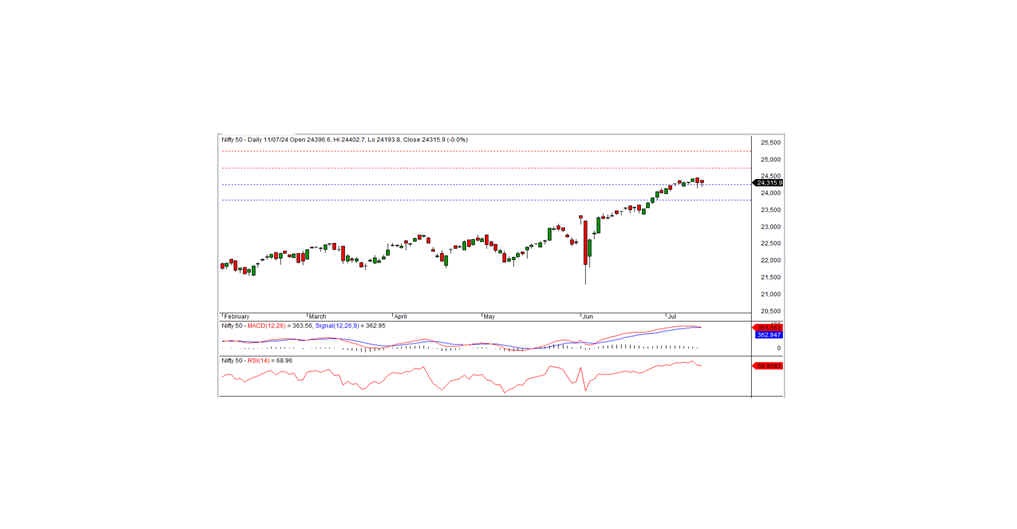
In the last trading session, the Nifty closed at 24,315.90, down -8.50 points or -0.03 percent. The downtrend will continue if the index closes below the intraday support level of 24,250.
The Nifty opened at 24,396.60 with a positive bias but failed to maintain the momentum, hitting an intraday low of 24,193.80. However, the index recovered from this low in the afternoon trade and closed at 24,315.90. Major sector gainers included media, FMCG, banking, and IT, while realty, pharma, auto, and financial services sectors saw declines. The market breadth was positive, with 1,452 stocks rising, 1,073 falling, and 113 remaining unchanged. The top gainers in the Nifty index were ONGC, BPCL, Coal India, and ITC. Conversely, the major losers included Tata Consumer Products, Bajaj Finance, M&M, and Divi's Laboratories.
From a technical standpoint, momentum indicators signal a positive trend. The Nifty remains above both long-term and short-term moving averages. However, the index formed a black candle on the daily chart and closed below the previous day's close, indicating a negative bias. The index has short-term support at the 24,250 level, and if it closes below this level, the negative trend may continue today. The nearest intraday resistance is at 24,400. For a pullback rally, the index needs to surpass this level.
Intraday Levels: Support: 24,300, 24,225, 24,150 Resistance: 24,400, 24,475-24,550 (15-Minute Charts)
Positional Trading: Short-term Support: 24,250-23,800 Resistance: 24,750-25,250
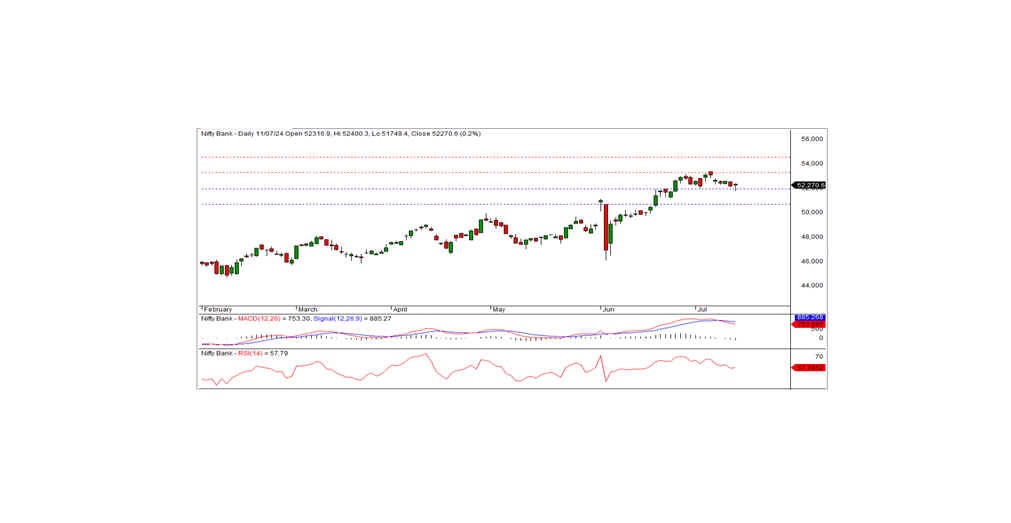
BANK NIFTY
In the preceding trading session, Bank Nifty closed at 52,270.65, registering a gain of 81.35 points. Technically, the momentum indicators signal a negative trend, and the index remains below the short-term moving averages. Moreover, the index formed a small black candle on the daily chart and closed inside the previous day's close. The long lower shadow of the candle indicates that buying interest emerged near the support zone.
On the higher side, the index has intraday resistance at the 52,350 level. If the index moves above this level, the positive trend can continue in the coming days. Otherwise, the index may consolidate above the support level of 51,900 for a few more days.
Intraday Levels: Support: 52,100, 51,900, 51,700 Resistance: 52,350, 52,600, 52,850 (15-Minute Charts)
Positional Trading: Short-term Support: 51,900-50,650 Resistance: 53,250-54,500