NIFTY TECHNICAL OUTLOOK
Based on Market Closing on Thursday, June 06, 2024
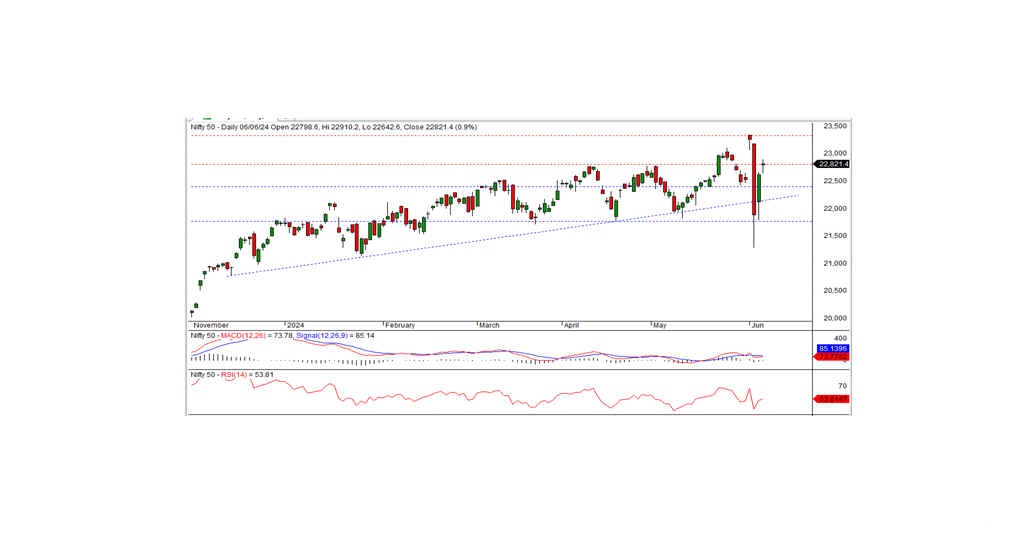
In the last trading session, the Nifty closed at 22821.40, up 201.05 points or 0.89 percent. The uptrend is expected to continue if the index remains above the 22800 level.
The Nifty opened at 22798.60 with a positive bias. Before moving further up, the index hit an intraday low of 22642.60. It then gradually rose, tested the intraday high of 22910.20, and closed at 22821.40. The realty, media, PSU bank, and IT sectors were the biggest gainers, while the FMCG, pharma, and private banks closed with a negative bias. Market breadth was positive, with 2087 stocks rising, 426 falling, and 99 remaining unchanged. Top gainers in the Nifty were HCLTECH, TECHM, SBILIFE, and SHRIRAMFIN, while major losers included HINDALCO, HEROMOTOCO, HINDUNILVR, and ASIAN PAINTS.
From a technical standpoint, momentum indicators signal a neutral trend. The Nifty remains above both long-term and short-term moving averages. In the last session, the index formed a Doji candle on the daily chart and closed above the previous day's candle, indicating a potential continuation of the uptrend. Short-term support for the index is located at 22800 levels. Positive trends will likely continue if the index stays above this level. The nearest intraday resistance is at 22900 levels.
Intraday Levels: Support: 22650, 22430, 22200 Resistance: 22900, 23100-23300 (15-Minute Charts)
Positional Trading: Short-term Support: 22400-21750 Resistance: 22800-23340
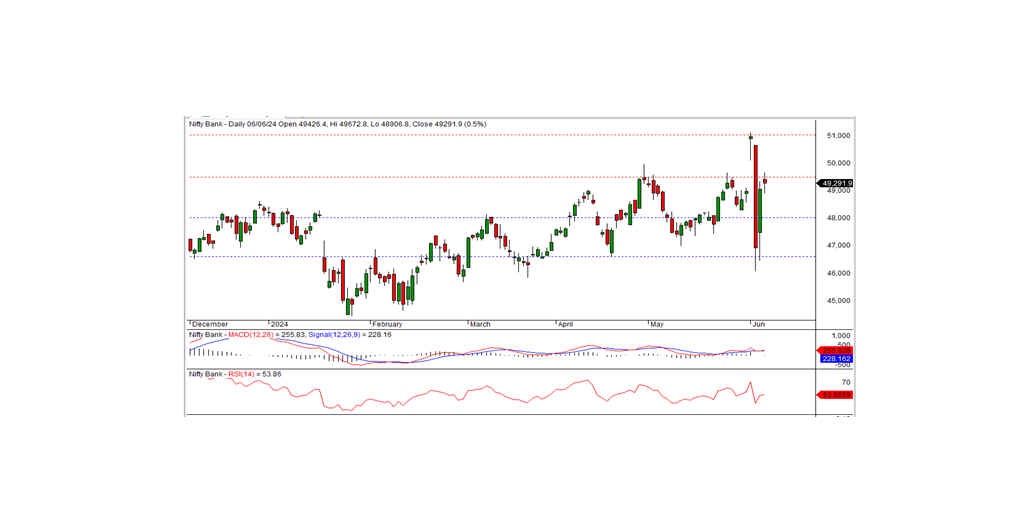
BANK NIFTY
In the preceding trading session, Bank Nifty closed at 49291.90, registering a gain of 237.30 points. Technically, momentum indicators signal a positive trend, and the index remains above the medium-term and short-term moving averages. The index formed a black candle on the daily chart but closed above the previous day's close, indicating a potential continuation of the uptrend.
On the higher side, 49500 acts as the nearest short-term resistance for the index. If the index closes above this level, the positive trend is likely to continue in the coming days. Otherwise, the index may consolidate below this level for a few days. The nearest intraday support is at 48950.
Intraday Levels: Support: 48950, 48500, 48000 Resistance: 49600, 50000, 50500 (15-Minute Charts)
Positional Trading: Short-term Support: 48000-46600 Resistance: 49500-51000