Nifty Technical Outlook
Based on Market Closing on Wednesday, August 28, 2024
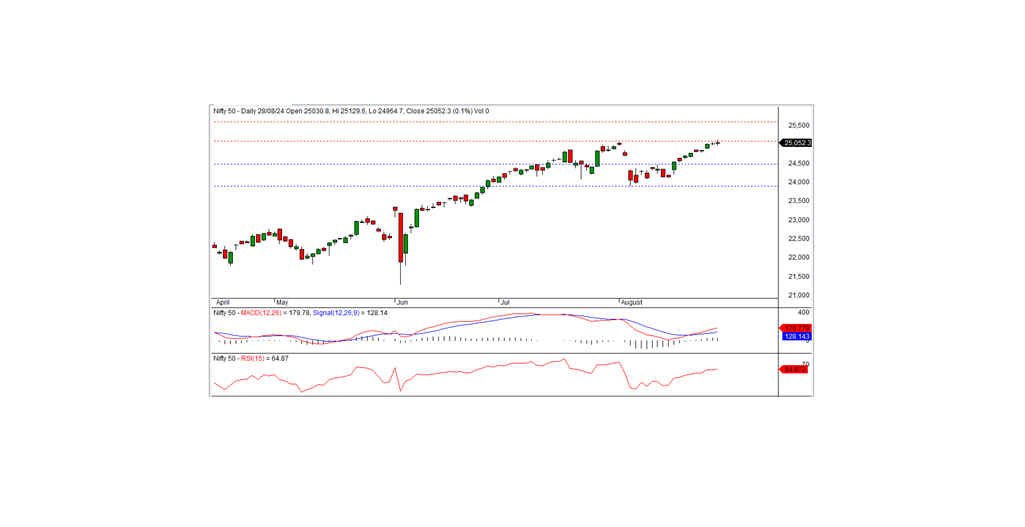
In the last trading session, the Nifty index closed at 25,052.35, gaining 34.60 points or 0.14%. If the Nifty closes above the resistance level of 25,080, the positive trend is likely to continue.
During the session, the Nifty opened with a positive bias at 25,030.80, dipped to a low of 24,964.70 in the morning, and then gradually climbed to a record high of 25,129.60. However, profit booking occurred towards the end, bringing the index down to 25,052.35 at the close. All sectors except IT and pharma ended in the red, with media, banks, FMCG, and financial services being the biggest losers. The market breadth was negative, with 1,035 stocks rising, 1,510 falling, and 140 remaining unchanged. The top gainers included LTIM, WIPRO, DIVISLAB, and INDUSINDBK, while ASIANPAINT, ADANIENT, NESTLEIND, and MARUTI were the major losers.
Technical Analysis
The Nifty index shows a bullish trend, supported by positive momentum indicators and its position above key moving averages. The index is currently facing resistance at 25,080, and a close above this level could extend the upward movement. However, if it fails to break this resistance, there may be a pullback towards the nearest intraday support levels at 25,020 or lower. For intraday traders, maintaining caution around the key support and resistance levels is advisable.
Intraday Levels: Support: 25,020, 24,960, 24,900 Resistance: 25,080, 25,140-25,200 (15-minute charts)
Positional Trading Levels: Short-term Support: 24,475 - 23,900 Resistance: 25,100 - 25,600
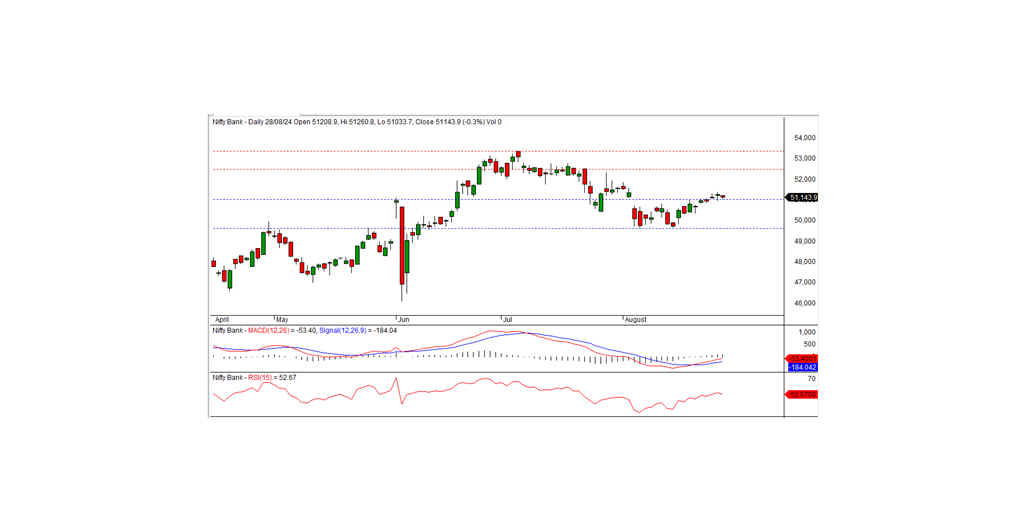
Bank Nifty Overview
In the last trading session, Bank Nifty closed at 51,143.85, down by 134.90 points. The momentum indicators point to a positive trend, and the index remains above both its short-term and long-term moving averages, but it did form a small black candle on the daily chart, closing below the previous day's level. On the downside, the index has short-term support at the 51,000 level. If it falls below this mark, a negative trend may emerge in the coming days; otherwise, the index might consolidate above this level for a few days. The nearest intraday resistance is at 51,250.
Intraday Trading Levels: Support: 51,000, 50,800, 50,650 Resistance: 51,250, 51,400, 51,600 (15-minute charts)
Positional Trading Levels: Support: 51,000 - 49,600 Resistance: 52,500 - 53,400