
Nifty Technical Outlook
Based on Market Closing on Friday, September 6, 2024
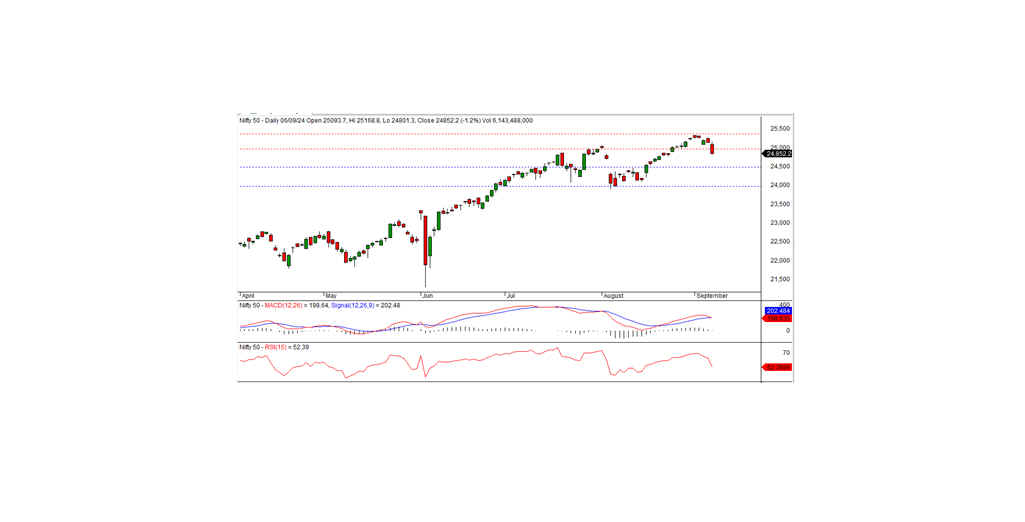
In the last trading session, the Nifty closed at 24,852.15, reflecting a decline of 292.95 points or 1.17%. The downward bias is likely to persist if the index breaks below the critical 24,800 level.
The session began on a negative note, with the Nifty opening at 25,093.70 and remaining under pressure throughout the day. The index reached an intraday low of 24,801.30 before settling at 24,852.15. All sectors closed in negative territory, with banks, financial services, auto, and media sectors witnessing the biggest losses. Market breadth was broadly negative, with 709 stocks advancing, 1,863 declining, and 124 remaining unchanged. Among the top gainers were ASIANPAINT, BAJFINANCE, JSWSTEEL, and DIVISLAB, while major laggards included SBIN, BPCL, ICICIBANK, and NTPC.
From a technical perspective, momentum indicators suggest a continuation of the bearish trend as the Nifty closed below its short-term moving averages. Additionally, the formation of a black candle on the daily chart, along with a close near the day's low, signals a negative outlook for the index. Resistance is seen at 25,000 in the near term, while support lies at 24,800.
The Nifty is in a precarious position with a clear negative bias, particularly if it breaches the 24,800 support level. The overall technical indicators and market sentiment point toward further downside risks in the near term. However, a decisive close above 25,000 could signal a potential reversal, offering room for recovery. Traders should remain cautious and closely monitor key levels for potential trading opportunities.
Intraday Levels: Support: 24,800, 24,700, 24,600 Resistance: 24,900, 25,000-25,100 (Based on 15-Minute Charts)
Positional Trading Levels: Short-term Support: 24,500 - 24,000 Resistance: 25,000 - 25,350
Bank Nifty Technical Outlook
In the previous trading session, Bank Nifty closed at 50,576.85, reflecting a significant decline of 896.20 points. Technically, momentum indicators point to a bearish trend, with the index closing below its short-term moving averages. Additionally, the formation of a black candle on the daily chart and a close near the day's low reinforce the likelihood of a continued downtrend.
On the upside, the index faces resistance at the 50,700 level, while intraday support is seen at 50,400. Bank Nifty appears to be under continued bearish pressure, particularly if it sustains below the 50,400 level. The technical indicators and price action suggest a cautious approach in the near term, with further downside risks likely. However, a close above 50,700 could trigger a pullback rally. Traders should remain vigilant and monitor key levels for trading opportunities in both intraday and positional strategies.
Intraday Levels: Support: 50,400, 50,200, 50,000 Resistance: 50,600, 50,800, 51,000 (Based on 15-Minute Charts) Positional Trading Levels: Short-term Support: 49,600 - 48,250 Resistance: 50,700 - 51,750