NIFTY TECHNICAL OUTLOOK
Based on Market Closing on Monday, August 05, 2024
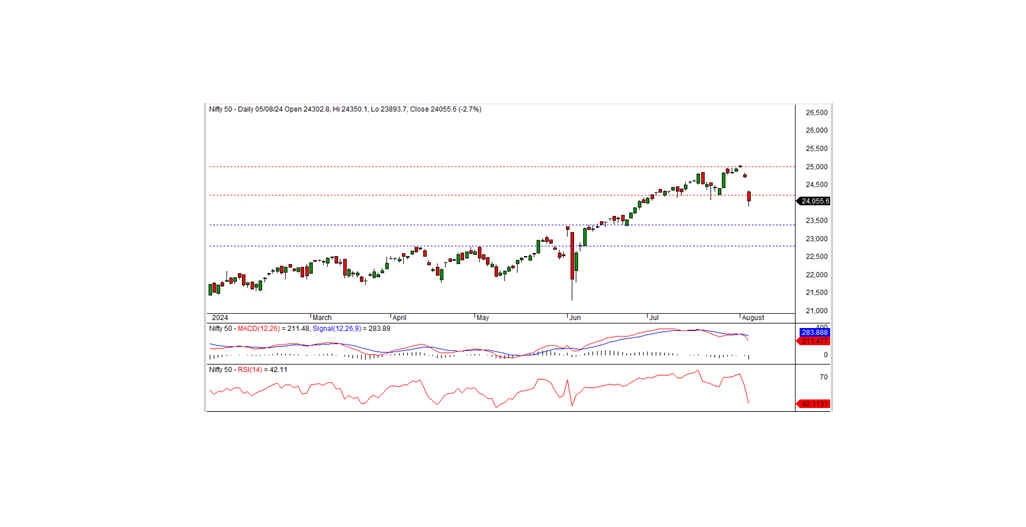
In the last trading session, the Nifty closed at 24,055.60, down 662.10 points or 2.68%. The downtrend is likely to continue today if the Nifty remains below the short-term resistance level of 24,200.
The Nifty opened with a downward gap at 24,302.80 in the last session, and this negative trend persisted throughout the day, hitting an intraday low of 23,893.70 before closing at 24,055.60. All sectors ended with a negative bias, with metals, media, realty, and PSU banks being the biggest losers. Market breadth was negative, with 265 stocks rising, 2,334 falling, and 57 remaining unchanged. The top gainers in the Nifty index were HINDUNILVR, NESTLEIND, HDFCLIFE, and TATACONSUM, while the major losers included TATAMOTORS, ONGC, ADANIPORTS, and TATASTEEL.
From a technical standpoint, momentum indicators signal a negative trend, and the Nifty remains below its short-term moving averages. The index formed a black candle on the daily chart and closed well below the previous day's close, all of which suggests a continuing downtrend. On the higher side, the index faces resistance at the 24,200 level. If the index remains below this level, the downtrend is expected to persist in the coming days. The next short-term support is in the 23,500-23,350 area.
Intraday Levels: Support: 23,900, 23,750, 23,600 Resistance: 24,100, 24,250-24,400 (15-Minute Charts)
Positional Trading: Short-term Support: 23,500-22,800 Resistance: 24,200-25,000
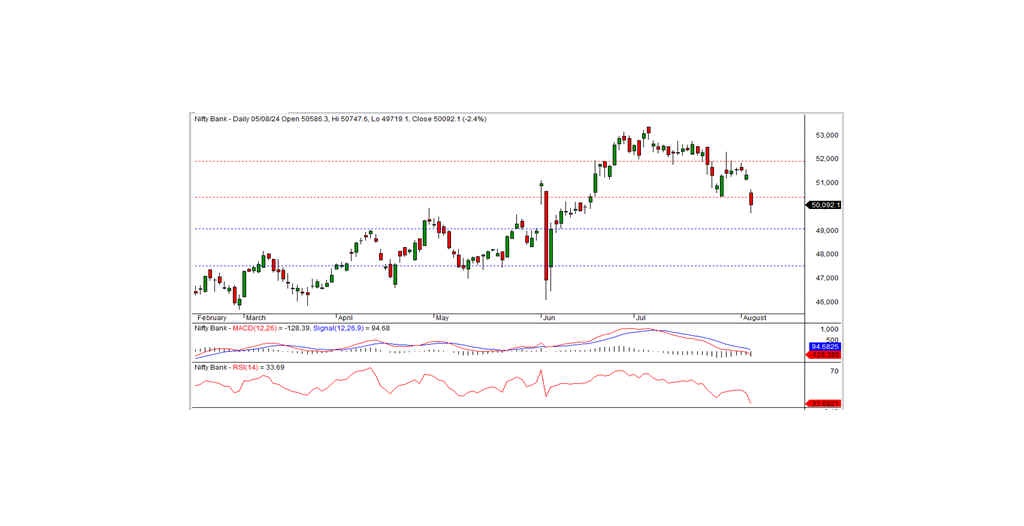
BANK NIFTY
In the preceding trading session, Bank Nifty closed at 50,092.10, registering a loss of 1,258.05 points. From a technical point of view, momentum indicators suggest a downward trend, and the index remains below its short-term moving averages. The index formed a black candle on the daily chart and closed below the previous day's close, indicating that momentum remains in favor of the bears.
On the lower side, the index has intraday support at the 50,000 level. If the index moves below this level, the downtrend is likely to continue. The nearest intraday resistance is at the 50,275 level. The index must trade and sustain above this level for a pullback rally. The short-term support remains at the 49,000 level.
For Intraday Traders: Support Levels: 50,000, 49,800, 49,600 Resistance Levels: 50,275, 50,500, 50,800 (15-Minute Charts)
For Positional Traders: Short-term Support Levels: 49,000-47,500 Resistance Levels: 50,400-51,900