NIFTY TECHNICAL OUTLOOK
Based on Market Closing on Monday, August 20, 2024
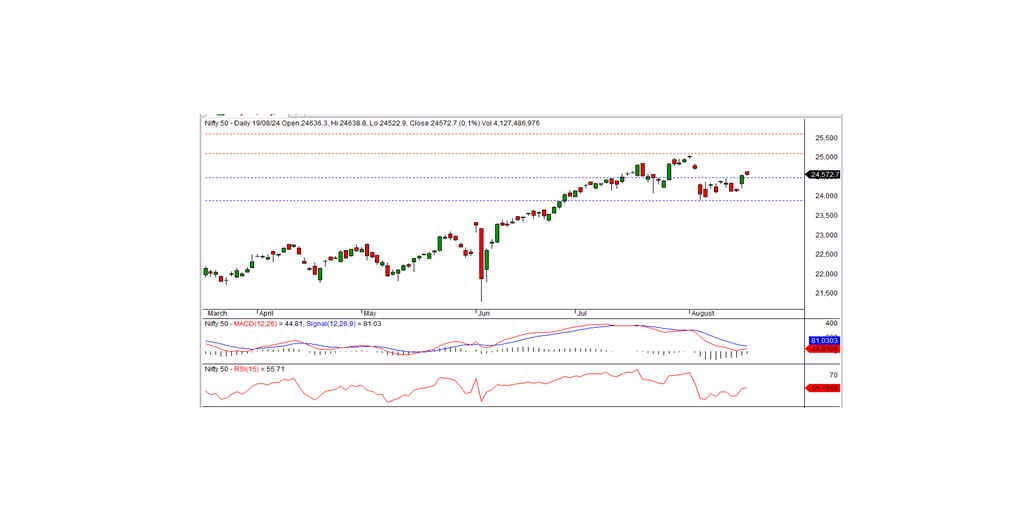
In the last trading session, the Nifty closed at 24,572.65, up 31.50 points or 0.13%. The positive trend is likely to continue if the Nifty remains above the intraday support level of 24,525.
The Nifty opened at 24,636.30 level on a positive bias and tested an intraday high of 24,638.80. However, the index failed to sustain the momentum, gradually declining to hit an intraday low of 24,522.90 before closing at 24,572.65. The biggest sectoral gainers were Metals, PSU Banks, Media, and IT, while the laggards included Auto, Banks, and Financial Services. Market breadth was positive, with 1,858 stocks advancing, 731 declining, and 84 remaining unchanged. The top gainers in the Nifty index were HINDALCO, BPCL, SHRIRAMFIN, and TATASTEEL, while the major losers were M&M, INDUSINDBK, BAJAJ-AUTO, and AXISBANK.
Technically, momentum indicators signal a neutral trend, but the Nifty remains above both its short-term and long-term moving averages. The index formed a black candle on the daily chart but still managed to close above the previous day's close, suggesting a potential continuation of the uptrend. On the downside, intraday support is at 24,525. If the index stays above this level, the bullish trend is expected to persist in the coming days. The nearest intraday resistance is at 24,600.
Intraday Levels: Support: 24,525, 24,450, 24,375 Resistance: 24,600, 24,675-24,750 (15-Minute Charts)
Positional Trading: Short-term Support: 24,475 - 23,900 Resistance: 25,100 - 25,600
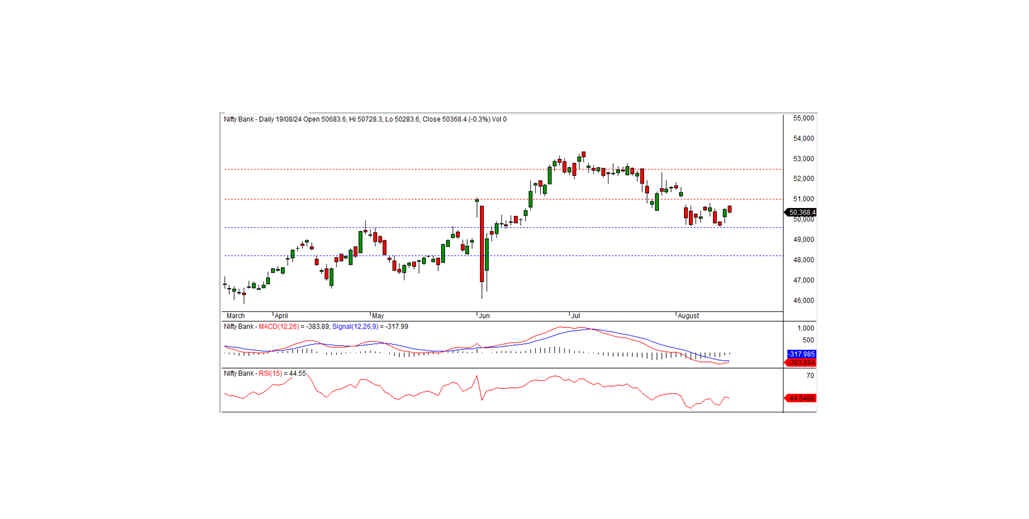
BANK NIFTY
In the previous trading session, Bank Nifty closed at 50,368.35, registering a loss of 148.55 points. From a technical standpoint, momentum indicators suggest a downward trend, though the index remains above its short-term moving averages. However, the index formed a black candle on the daily chart and closed below the previous day's close, indicating the possibility of consolidation.
On the downside, the index has intraday support at the 50,300 level, with key resistance at 50,500. If the index falls below 50,300, a further downtrend is likely today. Conversely, for a pullback rally, the index needs to move above 50,500.
Intraday Levels: Support: 50,500, 50,100, 49,900 Resistance: 50,500, 50,700, 50,900 (15-Minute Charts)
Positional Trading: Short-term Support: 49,600 - 48,200 Resistance: 51,000 - 52,500