NIFTY TECHNICAL OUTLOOK
Based on Market Closing on Friday, December 20, 2024
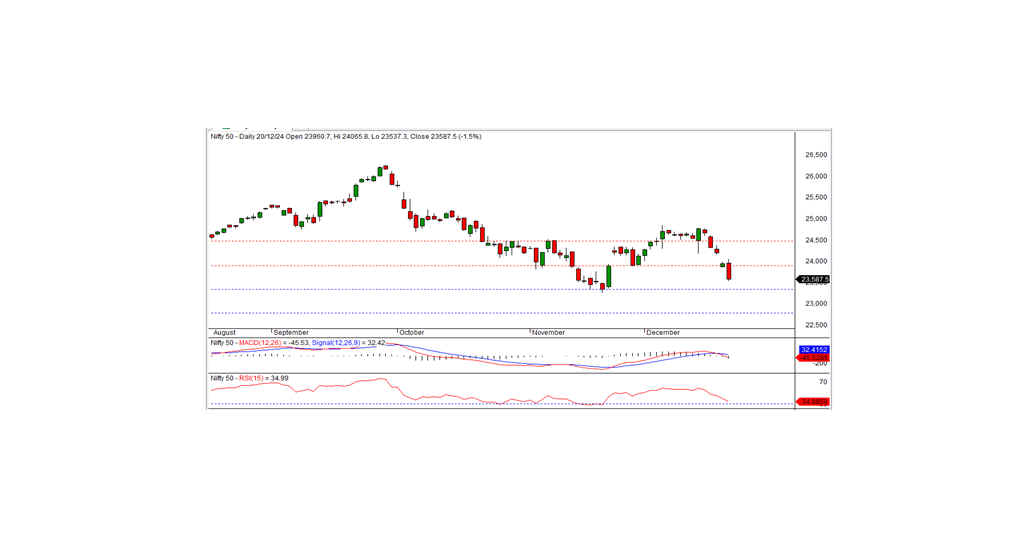
The Nifty ended the previous session at 23,587.50, marking a loss of 364.20 points or 1.52%. The downtrend is expected to persist if the index falls below the intraday support level of 23,530.
During Friday’s session, the Nifty opened positively at 23,960.70 and briefly reached an intraday high of 24,065.80 during morning trade. However, the momentum did not sustain, and the index gradually declined, hitting an intraday low of 23,537.30 before closing at 23,587.50.
Sectoral performance was broadly negative, with all sectors ending in the red. Media, IT, Auto, and PSU Banks saw the most significant sectoral declines. The market breadth was overwhelmingly negative, with 555 stocks advancing, 2,270 declining, and 68 remaining unchanged. Notable gainers in the Nifty were Dr. Reddy, ICICI Bank, Nestlé India, and HDFC Life, while the major losers included Tech Mahindra, Axis Bank, IndusInd Bank, and M&M.
Technically, the momentum indicators reflect a negative bias, with the index trading below its short-term and medium-term moving averages. A long black candle formation on the daily chart further indicates the potential for a continued downtrend. The Nifty’s failure to sustain early gains, coupled with bearish candlestick patterns and negative sectoral performance, underscores the likelihood of further downside. Traders should monitor the 23,530 support level closely, as a breach could open doors for a deeper correction. Conversely, a move above 23,675 may offer some respite, signaling the potential for a short-term pullback.
For intraday trading, key supports are at 23,530, 23,400, and 23,300, while resistances lie at 23,675, 23,800, and 23,965.
Positional traders should monitor short-term supports at 23,300–22,750 and resistances at 23,900–24,500.
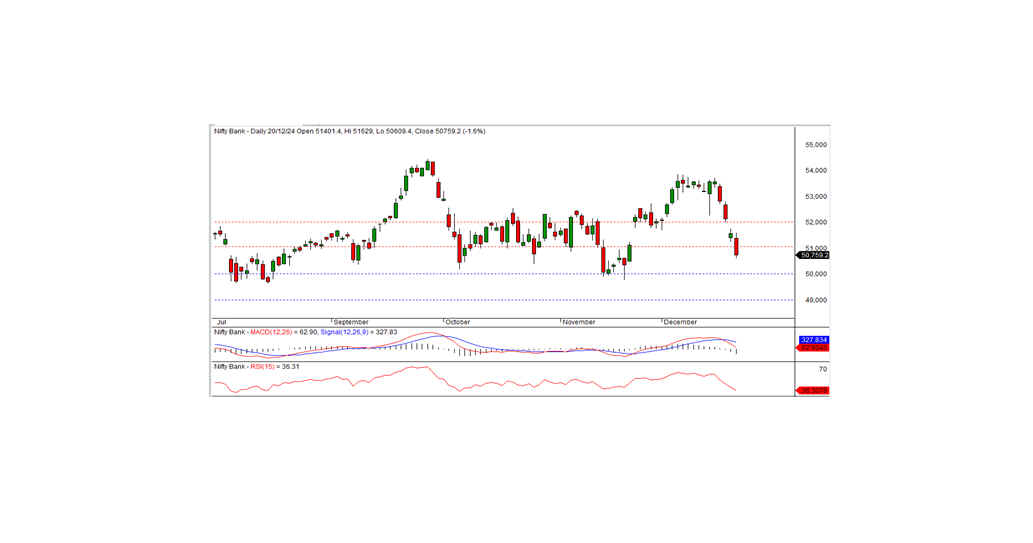
BANK NIFTY TECHNICAL OUTLOOK
In the preceding session, Bank Nifty closed at 50,759.20, recording a significant loss of 816.50 points. Technically, momentum indicators signal a negative trend, with the index trading below its short-term and medium-term moving averages. Additionally, a long black candle formed on the daily chart, closing well below the prior session's low, reinforces the bearish outlook. The index has immediate intraday support at 50,600, and a break below this level could extend the downtrend in the coming sessions. On the upside, the nearest intraday resistance is at 50,960, and a sustained move above this level is essential for a pullback rally.
As per the 15-minute charts, intraday support levels are at 50,600, 50,300, and 50,000, while resistance levels are seen at 50,960, 51,200, and 51,600.
For positional traders, the short-term support zone is at 50,000–49,000, with resistance at 51,000–52,000.
The current technical setup indicates a strong bearish bias, with traders advised to monitor these critical levels for any potential reversal or continuation of the downtrend.