NIFTY TECHNICAL OUTLOOK
Based on Market Closing on Wednesday, September 25, 2024
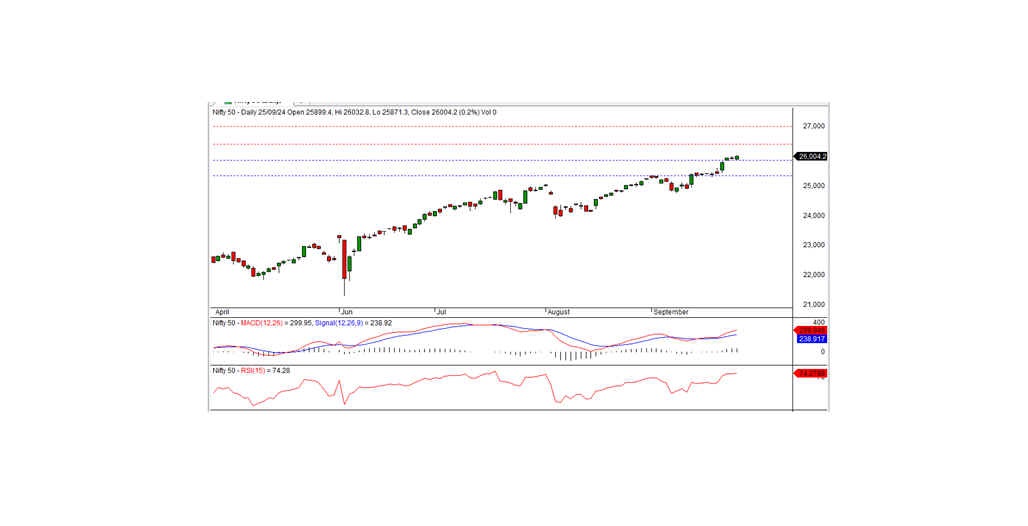
In the latest trading session, the Nifty closed at a record high of 26,004.15, rising 63.75 points or 0.25%. The bullish trend is expected to persist if the index remains above the key intraday support level of 25,980.
Nifty opened with a negative bias at 25,899.40, reaching an intraday low of 25,871.30 during the morning session. However, the index regained momentum in the afternoon, testing a new record high of 26,032.80 before settling at 26,004.15. Sector-wise, the media, realty, metal, and financial services sectors led the gains, while PSU banks, IT, FMCG, and auto sectors underperformed. The market breadth was negative, with 1,018 stocks advancing, 1,578 declining, and 120 remaining unchanged. POWERGRID, AXISBANK, NTPC, and GRASIM were the top Nifty gainers, while LTIM, TECHM, TATACONSUM, and TATAMOTORS were among the top losers.
From a technical perspective, momentum indicators suggest a continued positive trend, with Nifty holding above both short-term and long-term moving averages. Additionally, the formation of a white candle on the daily chart, along with the record closing high, indicates that bullish momentum is intact. On the downside, the index has intraday support at 25,980, while immediate resistance is at 26,060. A sustained move above this resistance level could lead the index toward the next short-term target of 26,400. However, traders should watch key support levels for any signs of reversal.
Intraday Levels: Support: 25,980, 25,900, 25,820 Resistance: 26,060, 26,130–26,200 (15-Minute Charts)
Positional Trading: Short-term support: 25,850–25,350 Resistance: 26,400–27,000

BANK NIFTY TECHNICAL OUTLOOK
In the last trading session, Bank Nifty closed at 54,101.65, gaining 133.05 points. Technically, momentum indicators suggest a positive trend, with the index holding above both its short-term and long-term moving averages. Furthermore, the formation of a white candle on the daily chart, combined with a close above the previous session's high, indicates a potential continuation of the bullish momentum. Bank Nifty’s positive close, supported by technical indicators and chart patterns, signals that the bulls are still in control.
On the upside, Bank Nifty faces immediate intraday resistance at 54,200, while support lies at 53,950. For the bullish trend to persist, the index needs to break above the intraday resistance level of 54,200. However, traders should monitor the support levels closely to manage any downside risk.
Intraday Levels: Support: 53,950, 53,800, 53,600 Resistance: 54,200, 54,400, 54,600 (15-Minute Charts)
Positional Trading: Short-term support: 53,400–52,100 Resistance: 54,500–55,600

