Nifty Technical Outlook
Based on Market Closing on Monday, September 30, 2024
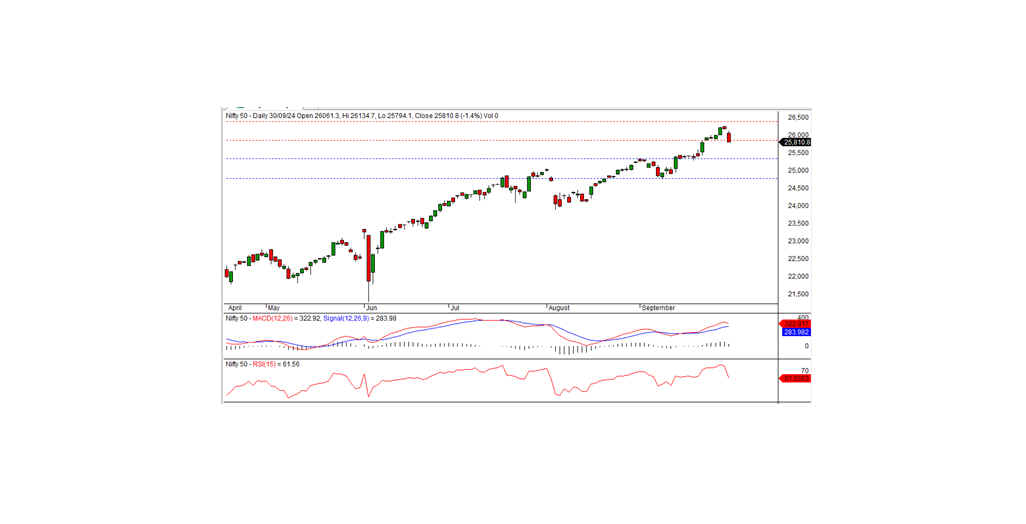
In the previous trading session, the Nifty closed at 25,810.85, marking a decline of 368.10 points or -1.41%. A downward trend continuation is expected if the index falls below the intraday support level of 25,800.
The session began with a negative opening at 26,061.31, and the bearish sentiment persisted throughout, leading to an intraday low of 25,794.10 before closing slightly higher at 25,810.85. The metal and media sectors led gains, while the auto, financial services, banking, and realty sectors were the biggest losers. The overall market breadth was weak, with 1,062 stocks advancing, 1,550 declining, and 139 remaining unchanged. The top performers within the Nifty were JSW Steel, NTPC, Hindalco, and Tata Steel, while Hero MotoCorp, Trent, Reliance, and Axis Bank were the major laggards.
From a technical perspective, momentum indicators are still signaling a positive trend as the Nifty remains above its medium- and long-term moving averages. However, the index formed a long black candle on the daily chart and closed below the prior session's close, which suggests a negative bias. The intraday support is at 25,800.
The Nifty's recent decline, coupled with the formation of a long black candle, points to a negative bias in the near term. If the index breaks below the critical support level of 25,800, further downside pressure may be expected. However, a sustained move above the 25,875 resistance level could spark a short-term recovery. Traders should remain cautious, closely monitoring intraday support and resistance levels for potential breakouts or pullbacks, while keeping an eye on sectoral performance for additional cues.
Intraday Levels: Support: 25,800, 25,725, 25,650 Resistance: 25,875, 25,950-26,035 (15-Minute Charts)
Positional Trading: Short-term support: 25,350, 24,750 Resistance: 25,850, 26,400

Bank Nifty Technical Outlook
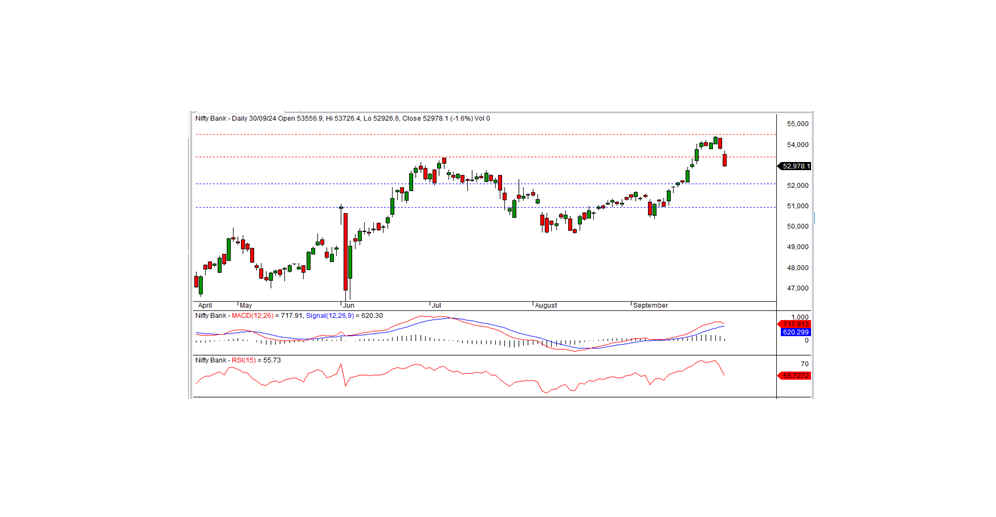
In the last trading session, Bank Nifty closed at 52,978.10, registering a sharp decline of 856.20 points. Despite momentum indicators suggesting a positive trend, the index closed below its short-term moving averages, signaling potential weakness. Additionally, the formation of a long black candle on the daily chart, with the close near the day's low, reinforces the negative bias for the index.
While momentum indicators remain positive, the bearish candle formation and close below short-term averages indicate caution. A breakdown below 52,900 could trigger further selling pressure, while holding this support level may lead to a short-term rebound. Intraday traders should closely watch these key levels for direction, while positional traders should monitor the broader support and resistance range for more sustained moves.
Intraday Levels: Support: 52,900, 52,700, 52,500 Resistance: 53,200, 53,400, 53,725
Positional Trading: Short-term support: 52,100, 51,000 Resistance: 53,400, 54,500

