Nifty Technical Outlook
Based on Market Closing on Monday, October 14, 2024
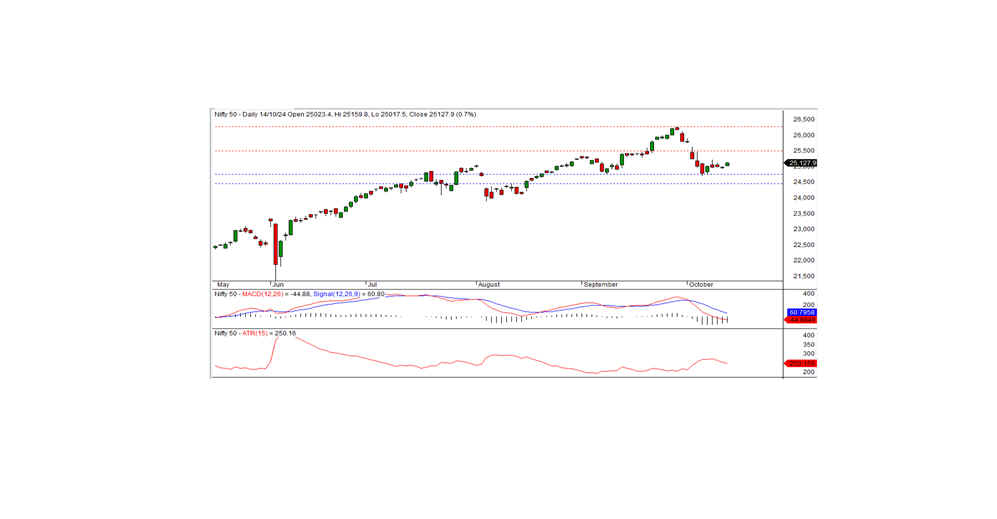
In the latest trading session, the Nifty closed at 25,127.95, gaining 163.70 points or 0.66%. A positive bias is likely to persist if the index sustains above the key intraday support level of 25,100.
The session began with a positive opening at 25,023.40, and the bullish momentum carried throughout, with the index touching an intraday high of 25,159.80 before settling at 25,127.95. All sectors, except media and metal, ended in positive territory, with realty, IT, banks, and financial services leading the gains. Despite the upward movement, market breadth was slightly negative, with 1,250 stocks advancing, 1,336 declining, and 156 remaining unchanged. The top gainers in the Nifty included WIPRO, TECHM, HDFCLIFE, and HDFCBANK, while ONGC, MARUTI, TATA STEEL, and BAJFINANCE were among the biggest losers.
Technically, while momentum indicators signal a bearish trend with Nifty remaining below its medium-term moving averages, the formation of a white candle on the daily chart is a bullish sign. This pattern, combined with the close above recent levels, indicates a potential continuation of the current uptrend. On the downside, the index has intraday support at 25,100, with resistance at 25,160. If Nifty manages to hold above 25,100, it could test the next short-term resistance at 25,500 in the coming sessions.
Intraday Levels Support: 25,100, 25,020, 24,965 Resistance: 25,160, 25,235, 25,300 (15-Minute Charts)
Positional Trading Levels Support: 24,750, 24,450 Resistance: 25,500, 26,275
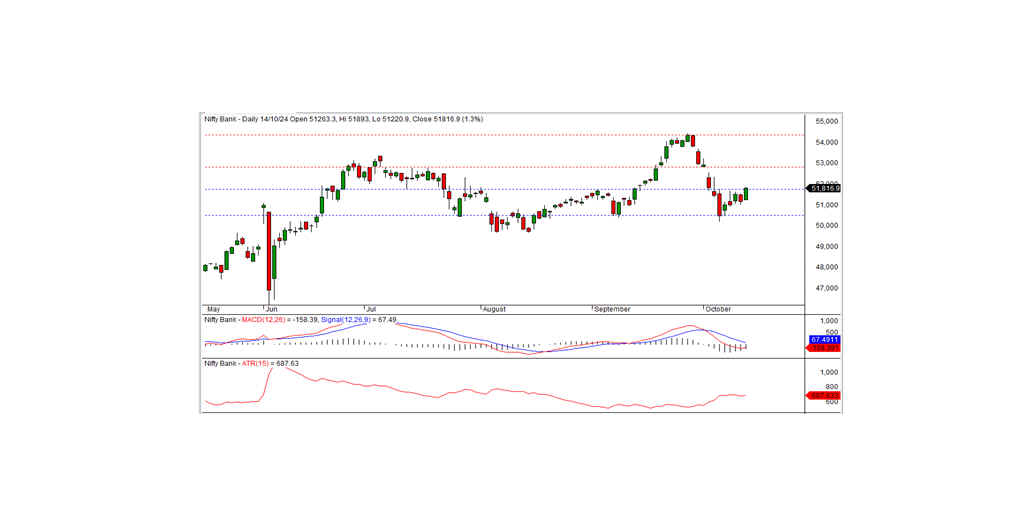
Bank Nifty Technical Outlook
In the previous trading session, Bank Nifty closed at 51,816.90, gaining 644.60 points. While momentum indicators continue to signal a negative trend, the index managed to close above its short-term moving averages. Additionally, the formation of a white candle on the daily chart, along with a close above the previous resistance of 51,750, suggests that momentum is shifting in favor of the bulls.
On the downside, the index finds intraday support at the 51,700 level, while resistance lies at 51,900. For the bullish momentum to sustain, Bank Nifty must break above the 51,900 resistance level.
According to the 15-minute charts, intraday traders should look at support levels at 51,700, 51,500, and 51,300, with resistance levels at 51,900, 52,100, and 52,300.
Positional Trading Levels Support: 51,750, 50,500 Resistance: 52,800, 54,460