NIFTY TECHNICAL OUTLOOK
Based on Market Closing on Friday, October 04, 2024
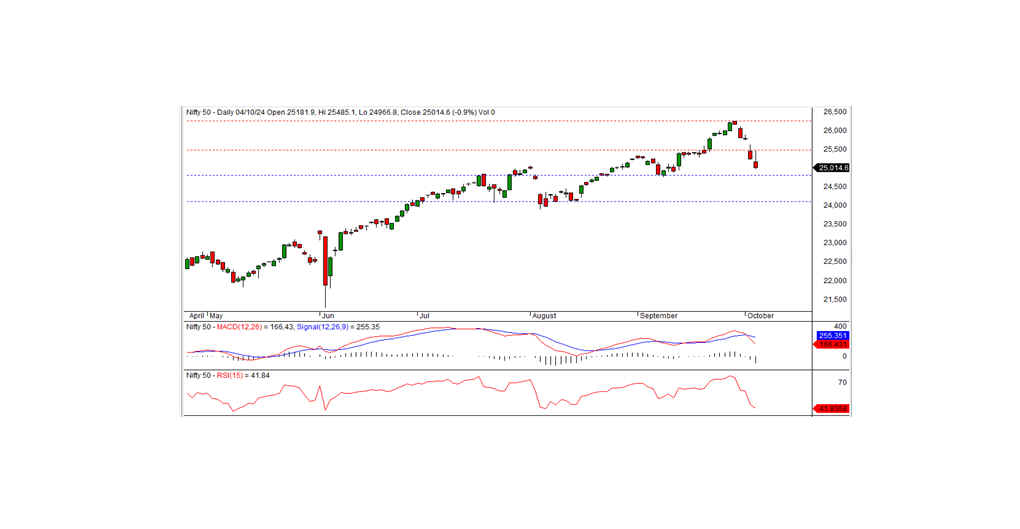
In the latest trading session, the Nifty ended at 25,014.60, dropping by 235.50 points or 0.93%. The bearish momentum is expected to persist if the index slips below the intraday support level of 25,000.
During the previous session, Nifty opened with a downward gap at 25,181.90. After briefly testing the intraday high of 25,485.10 in early trade, the index lost momentum, falling sharply to an intraday low of 24,966.80 before closing at 25,014.60. Most sectors closed in negative territory, with the exception of PSU banks and IT. Media, FMCG, realty, and auto were the biggest losers. The market breadth was weak, with 837 stocks advancing, 1,833 declining, and 68 remaining unchanged. The top gainers within Nifty were INFY, ONGC, HDFCLIFE, and TECHM, while the top losers included M&M, BAJFINANCE, NESTLEIND, and HEROMOTOCO.
From a technical standpoint, momentum indicators point to a continuing negative trend, with the Nifty remaining below its short-term moving averages. The formation of a black candle on the daily chart, along with a close below the prior day's level, suggests that the momentum remains in favor of the bears.
On the downside, intraday support is at 25,000. If the index breaks below this level, the negative trend is likely to persist today. The nearest intraday resistance is at 25,125, and for a pullback rally to occur, the index needs to break above this level.
Intraday Levels: Support: 25,000, 24,850, 24,700 Resistance: 25,125, 25,300–25,470 (15-Minute Charts)
Positional Trading: Short-term Support: 24,800–24,100 Resistance: 25,500–26,275
BANK NIFTY TECHNICAL OUTLOOK
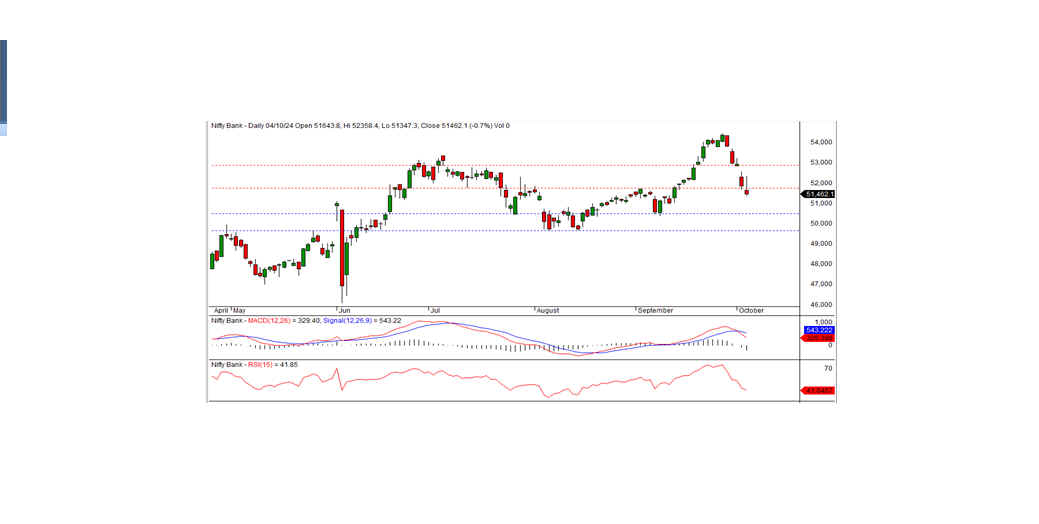
In the last trading session, Bank Nifty closed at 51,462.05, declining by 383.15 points. Technically, momentum indicators are pointing to a negative trend, with the index staying below its short-term moving averages. Additionally, a black candle was formed on the daily chart, closing below the previous day's level, reinforcing the continuation of the downward bias.
On the downside, the index has intraday support at 51,400. If it breaks below this level, further downside movement can be expected today. On the upside, the nearest resistance is at 51,750. A pullback rally could be seen if the index trades and sustains above this resistance level.
Intraday Levels (15-Minute Charts): Support: 51,400, 51,150, 50,850 Resistance: 51,750, 52,000, 52,350
Positional Trading: Short-term Support: 50,500–49,600 Resistance: 51,750–52,800