Nifty Technical Outlook
Based on Market Closing on Tuesday, August 27, 2024
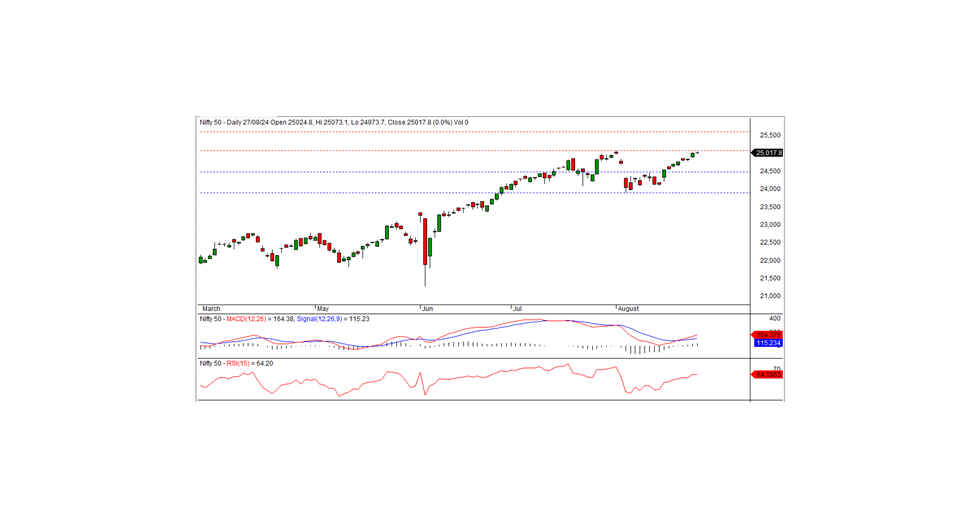
In the last trading session, the Nifty closed at 25,017.75, up by 7.15 points or 0.03%. The positive trend is expected to continue as long as the Nifty stays above the support level of 24,980.
The Nifty started the day with a positive opening at 25,024.80, reaching an intraday high of 25,073.10 in the morning. However, it gradually declined and closed at 25,017.75. Most sectors ended positively, except for FMCG, metal, and auto. The biggest gainers were in the metal, realty, IT, and financial services sectors. Market breadth was positive with 1,447 stocks rising, 1,145 falling, and 90 remaining unchanged. The top gainers in the Nifty index were SBILIFE, SHRIRAMFIN, MARUTI, and BAJAJFINSV, while TITAN, JSWSTEEL, HINDUNILVR, and TATAMOTORS were the major losers.
From a technical perspective, momentum indicators suggest a bullish trend, with the Nifty staying above both short-term and long-term moving averages. The index formed a small white candle on the daily chart, closing above the previous day's close, indicating the bullish trend may continue. The 25,080-25,100 area is acting as resistance. If the Nifty closes above this level, the upward momentum is likely to persist. The nearest intraday support is at 24,980.
Intraday Levels: Support: 24,980, 24,920, 24,850 Resistance: 25,080, 25,150-25,250 (15-Minute Charts)
Positional Trading: Short-term support: 24,475 - 23,900 Resistance: 25,100 - 25,600
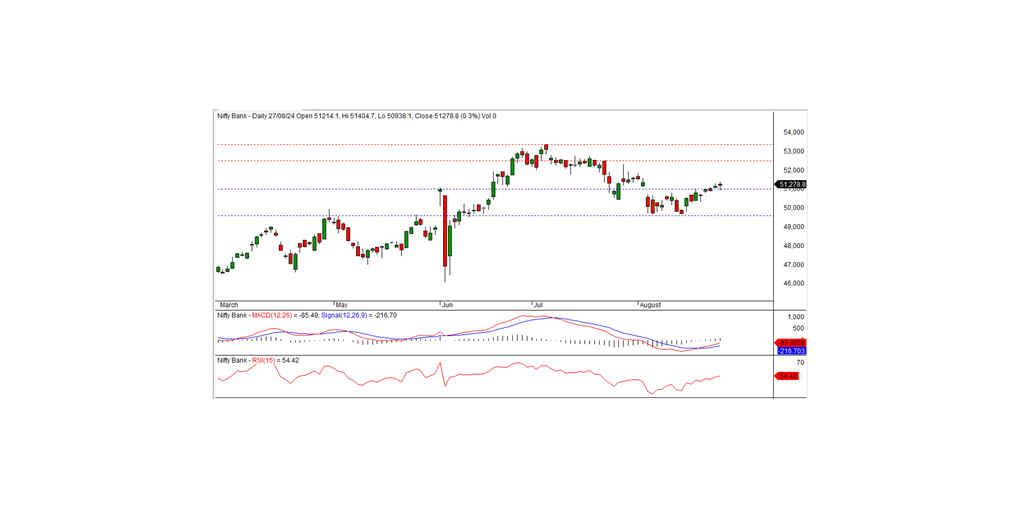
Bank Nifty
In the previous trading session, Bank Nifty closed at 51,278.75, gaining 130.65 points. Technically, momentum indicators suggest a positive trend, with the index staying above both its short-term and long-term moving averages. The index also formed a small white candle on the daily chart, closing above the previous day's close. There is short-term support at the 51,000 level, and if the index remains above this, the bullish trend is likely to continue. The nearest intraday resistance is at 51,400.
Intraday Levels: Support: 51,200, 51,000, 50,800 Resistance: 51,400, 51,600, 51,800 (15-Minute Charts)
Positional Trading: Short-term support: 51,000 - 49,600 Resistance: 52,500 - 53,400