NIFTY Technical Outlook
Based on Market Closing on Tuesday, July 30, 2024
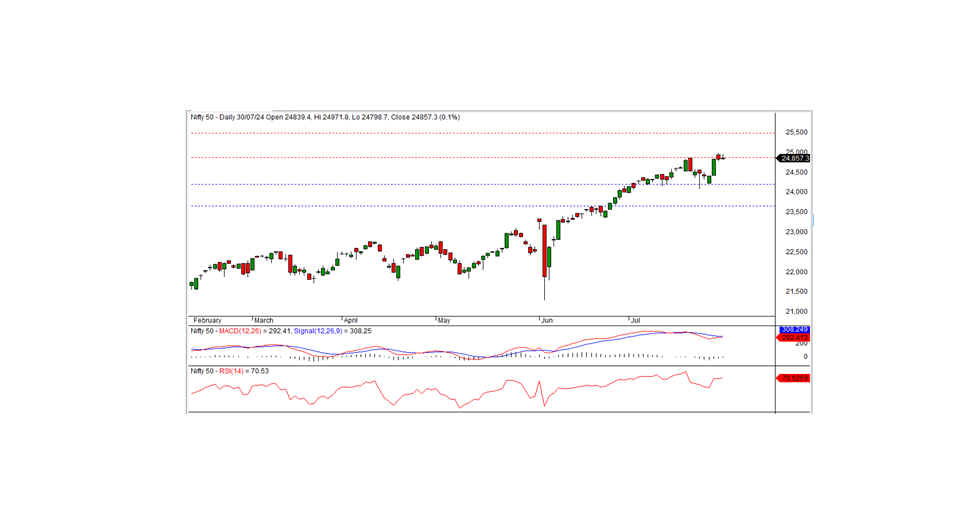
In the last trading session, the Nifty closed at 24,857.30, up 21.20 points or 0.09 percent. The bullish trend will continue if the Nifty remains above the intraday support level of 24,800.
The Nifty opened positively at 24,839.40 and initially dipped to an intraday low of 24,798.70 before climbing to an intraday high of 24,971.80, eventually closing at 24,857.30. The biggest sector gainers were Media, Auto, Realty, and Private Banks, while the losers included FMCG, Pharma, IT, and PSU Banks. The market breadth was positive, with 1,483 stocks rising, 1,078 falling, and 88 remaining unchanged. The top gainers in the Nifty index were Tata Motors, NTPC, BPCL, and Power Grid, while the major losers included LTIM, Cipla, SBI Life, and Grasim.
From a technical standpoint, the momentum indicators signal a neutral trend. However, the Nifty remains above both the short-term and long-term moving averages. Moreover, the index formed a small white candle on the daily chart and closed just above the previous day's close, indicating the possibility of a continuing bullish trend. On the higher side, the index faces resistance at the 24,870 level. If the index closes above this level, the short-term trend will turn bullish. Otherwise, the index may consolidate below this level for a few more days before continuing its uptrend. The nearest intraday support is at the 24,800 level.
Intraday Levels: Support: 24,800, 24,700, 24,600 Resistance: 24,900, 25,000-25,100 (15-Minute Charts)
Positional Trading: Short-term Support: 24,200-23,650 Resistance: 24,870-25,500
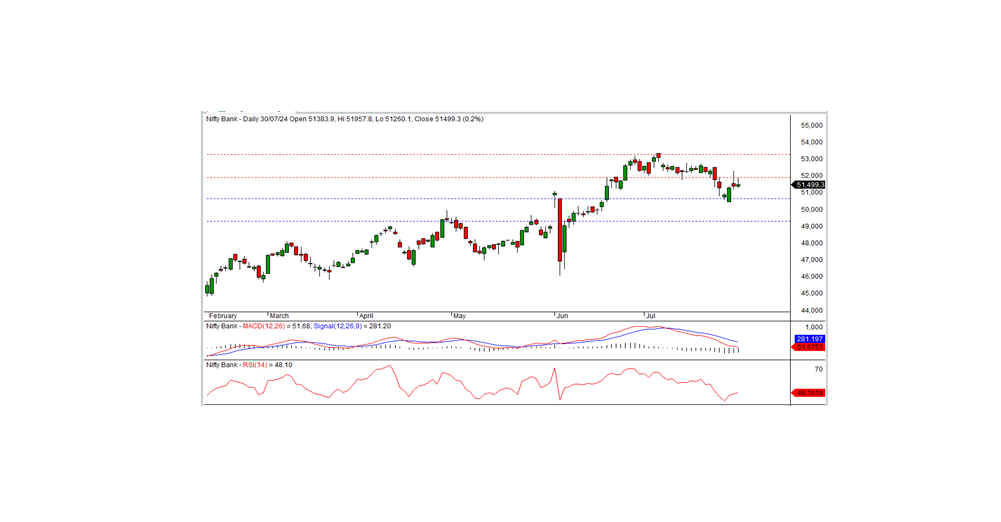
BANK NIFTY Technical Outlook
In the preceding trading session, Bank Nifty closed at 51,499.30, registering a gain of 93.05 points. On a technical level, the momentum indicators suggest a downward trend. Additionally, the index remains below its short-term moving averages. However, the index closed above the previous day's close with a small white candle on the daily chart. On the lower side, the index has intraday support at the 51,200 level. If the index remains above this level, bullish trends are likely to continue. The nearest intraday resistance is at the 51,600 level. For a strong bullish trend, the index needs to close above 51,900.
Intraday Levels: Support: 51,200, 50,900, 50,600 Resistance: 51,600, 51,950, 52,300 (15-Minute Charts)
Positional Trading: Short-term Support: 50,650-49,300 Resistance: 51,900-53,250