Nifty Technical Outlook
Based on Market Closing on Monday, August 12, 2024
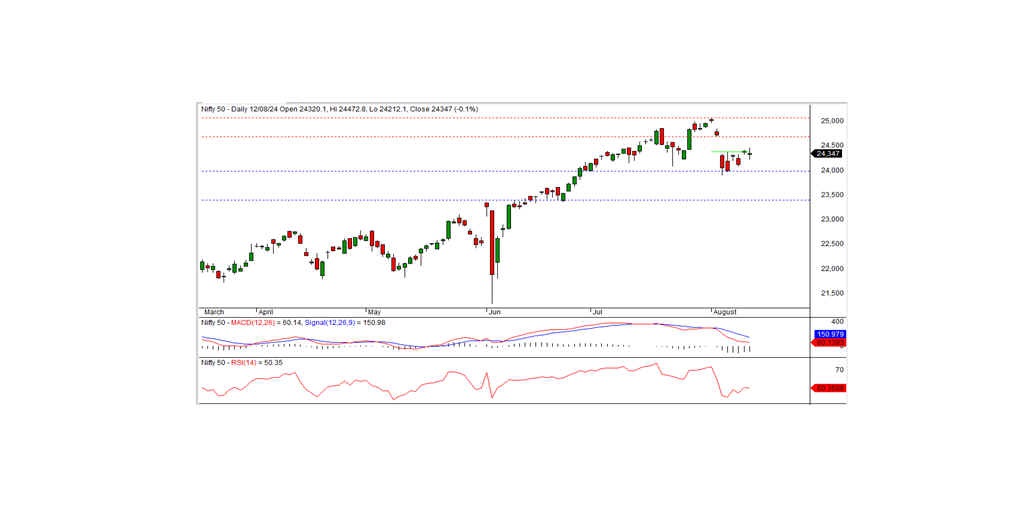
In the last trading session, the Nifty closed at 24,347.00, down by 20.50 points or 0.08%. For a positive trend to emerge, the index needs to trade and sustain above the 24,300.00 level.
The session opened with a negative bias at 24,320.10, and this downward trend continued, hitting an intraday low of 24,212.10 during the morning trade. However, the index rebounded, testing an intraday high of 24,472.80 before settling at 24,347.00. The biggest gainers were the Realty, Metal, Private Bank, and Financial Service sectors, while the major losers included Media, PSU Banks, FMCG, and Auto sectors. The market breadth was slightly negative, with 1,281 stocks advancing, 1,315 declining, and 73 remaining unchanged. The top gainers in the Nifty index were ONGC, Hero MotoCorp, Axis Bank, and Infosys, while the major losers were NTPC, Adani Ports, Dr. Reddy's, and Britannia.
From a technical standpoint, momentum indicators are signaling a negative trend, with the Nifty remaining below its short-term moving averages. The index formed a small white candle on the daily chart but closed lower than the previous day's close, suggesting a potential consolidation phase. On the downside, the index has intraday support at the 24,300 level, while resistance is seen at 24,400. If the index sustains above 24,300, a positive trend can be expected today.
Intraday Levels: Support: 24,300, 24,215, 24,100 Resistance: 24,400, 24,475-24,550 (15-Minute Charts)
Positional Trading: Short-term Support: 24,000-23,400 Resistance: 24,685-25,080
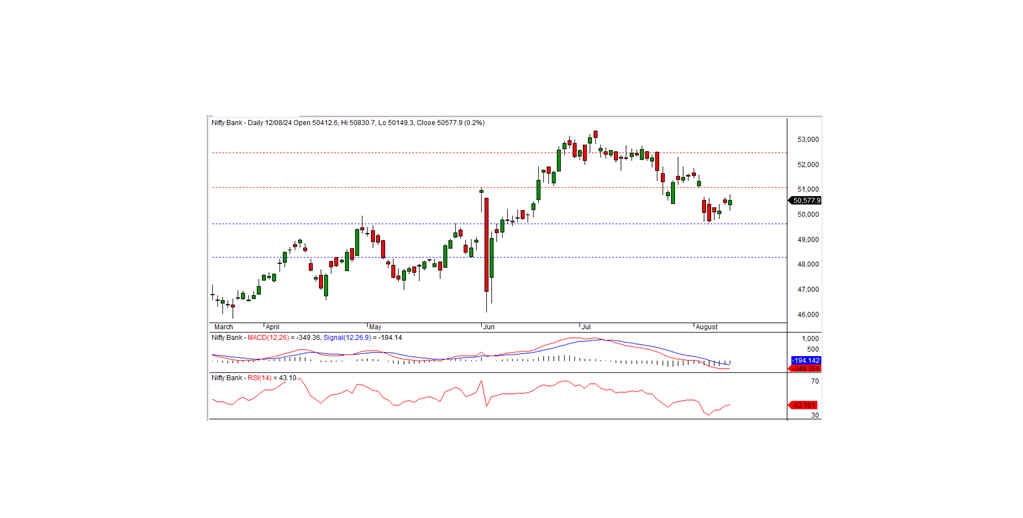
Bank Nifty Technical Outlook
In the previous trading session, Bank Nifty closed at 50,577.95, registering a gain of 93.45 points. From a technical perspective, momentum indicators suggest a downward trend, with the index remaining below its short-term moving averages. However, the index formed a small white candle on the daily chart and closed above the previous day's close, indicating the possibility of an ongoing uptrend.
On the downside, the index has intraday support at the 50,500 level, while resistance is seen at 50,800. A positive trend is likely to continue if the index moves above the resistance level; otherwise, it may consolidate below this level for a few days. On the higher side, short-term resistance remains at the 51,000 level.
Intraday Levels: Support: 50,500, 50,250, 50,000 Resistance: 50,800, 51,000, 51,200 (15-Minute Charts)
Positional Trading: Short-term Support: 49,600-48,300 Resistance: 51,000-52,450