NIFTY Technical Outlook
Based on Market Closing on Wednesday, July 10, 2024
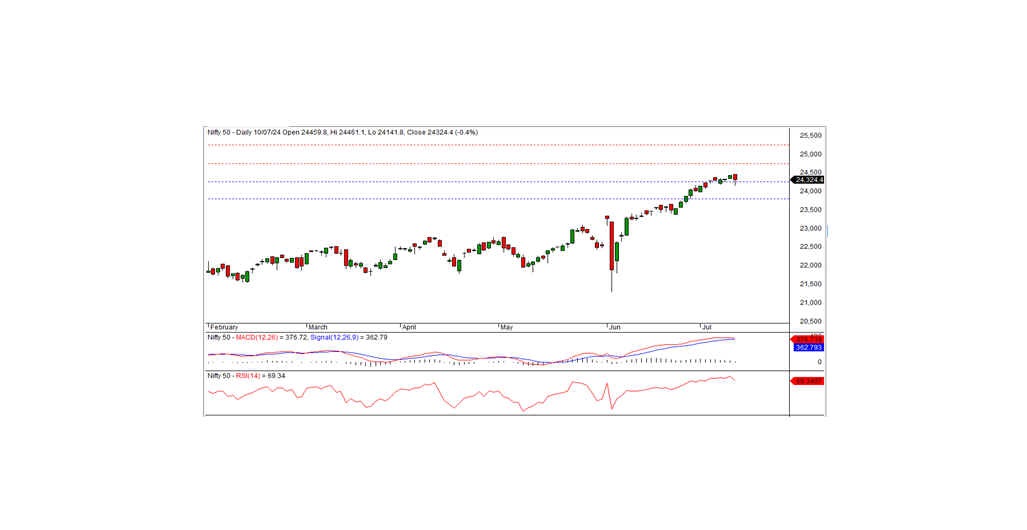
In the last trading session, the Nifty closed at 24,324.45, down 108.75 points or 0.45 percent. The downtrend may continue if the index moves below the intraday support level 24,300.
The Nifty opened at a record high of 24,459.80 but failed to maintain momentum. The index fell sharply to an intraday low of 24,141.80. However, it recovered from the low in the afternoon trade and closed at 24,324.45. All sectors, except Pharma and FMCG, closed with a negative bias. Major sector losers included Auto, Media, Metal, and PSU Banks. The market breadth was negative, with 822 stocks rising, 1,709 falling, and 106 remaining unchanged. The top gainers in the Nifty index were ASIANPAINT, SBILIFE, DIVISLAB, and BRITANNIA. Major losers included M&M, TATA STEEL, HINDALCO, and TCS.
From a technical standpoint, momentum indicators signal a positive trend. The Nifty remains above the long-term and short-term moving averages. However, the index formed a black candle on the daily chart and closed below the previous day's close, indicating a negative bias. The index has short-term support at the 24,250 level. If it moves below this level, the negative trend may continue. The nearest intraday resistance is at 24,400. For a pullback rally, the index needs to surpass this level.
Intraday Levels: Support: 24,300, 24,225, 24,150 Resistance: 24,400, 24,475-24,550 (15-Minute Charts)
Positional Trading: Short-term Support: 24,250-23,800 Resistance: 24,750-25,250
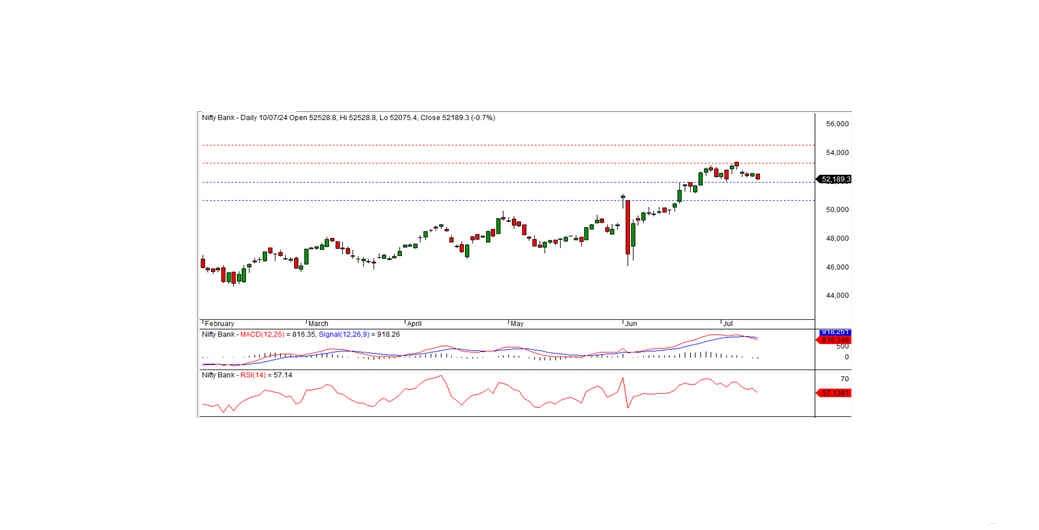
BANK NIFTY Technical Outlook
In the preceding trading session, Bank Nifty closed at 52,189.30, registering a loss of 379.50 points. Technically, the momentum indicators signal a negative trend, and the index closed below the short-term moving averages. Moreover, the index formed a small black candle on the daily chart and closed below the previous day's close, indicating a negative bias.
On the lower side, the index has short-term support at the 51,900 level. If the index closes below this level, the negative trend can continue in the coming days. Otherwise, the index may consolidate between the 51,900 and 52,700 levels for a few more days. The nearest intraday resistance is at the 52,350 level.
Intraday Levels: Support: 52,100, 51,900, 51,700 Resistance: 52,350, 52,600, 52,850 (15-Minute Charts)
Positional Trading: Short-term Support: 51,900-50,650 Resistance: 53,250-54,500