NIFTY TECHNICAL OUTLOOK
Based on Market Closing on Tuesday, August 06, 2024
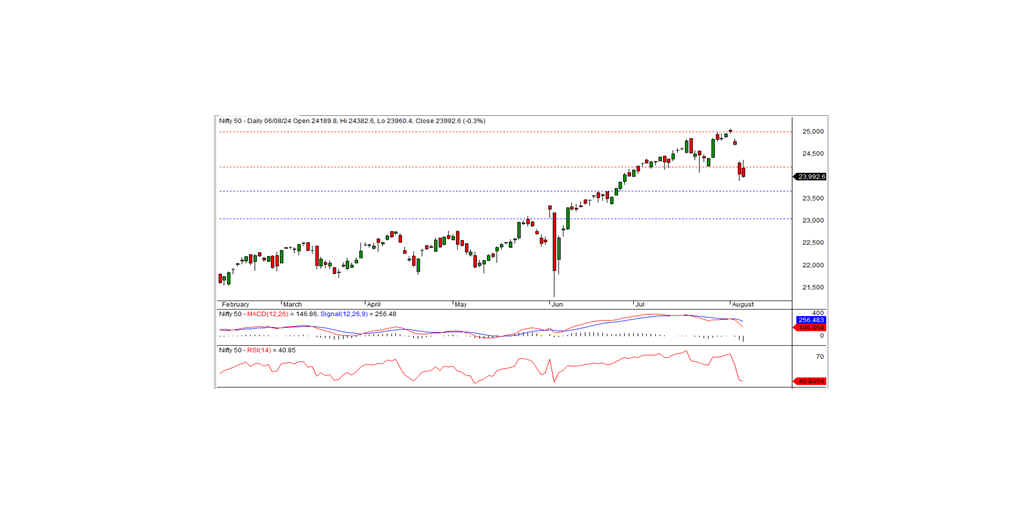
In the last trading session, the Nifty closed at 23992.55, down -63.05 points or -0.26 percent. The downtrend will continue today if the index moves below the intraday support level of 23900.
In the last trading session, the Nifty opened on a positive bias at 24189.80 and tested the intraday high of 24382.60 in the morning trade. Then the index gradually fell and hit the intraday low of 23960.40 before closing at 23992.55. The biggest sector gainers were realty, IT, metal, and media, while the losers were banks, financial services, and auto. The market breadth was negative with 869 stocks rising, 1714 falling, and 78 remaining unchanged. The top gainers in the Nifty index were BRITANNIA, JSWSTEEL, TECHM, and LT, while the major losers included HDFCLIFE, SBILIFE, BPCL, and SHRIRAMFIN.
From a technical standpoint, the momentum indicators signal a negative trend and the Nifty remains below the short-term moving averages. Moreover, the index formed a black candle on the daily chart and closed below the previous day's close. All these indicate the possibility of a further downtrend. On the lower side, the index has intraday support at the 23900 level. If the index moves below this level the downtrend will continue in the coming days. The nearest short-term resistance remains at 24200.
Intraday Levels: Support - 23900, 23750, 23600 Resistance - 24100, 24250-24400(15-Minute Charts)
Positional Trading: Short-term support - 23650-23000 Resistance - 24200- 25000.
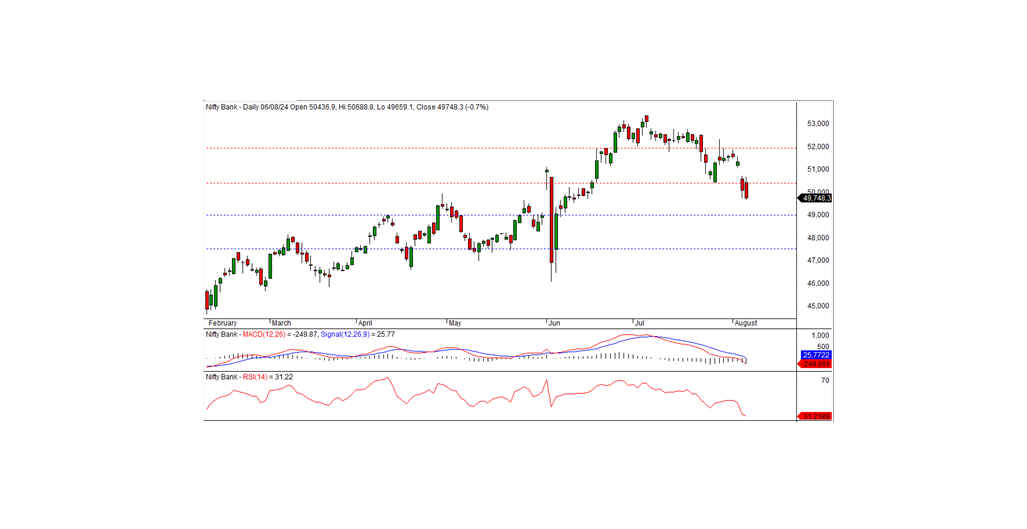
BANK NIFTY
In the preceding trading session, Bank Nifty closed at 49748.30 registering a loss of -343.80 points. From a technical point of view, the momentum indicators suggest a downward trend and the index remains below its short-term moving averages. Moreover, the index formed a black candle on the daily chart and closed below the previous day's close. All these indicate a negative bias for the index. On the lower side, the index has intraday support at the 49500 level. If the index moves below this level, the downtrend will likely continue. The nearest intraday resistance is at 49950 levels. The index must trade and sustain above this level for a pullback rally. On the lower side, the short-term support remains at 49000 levels
For intraday traders, the support levels are at 49950, 49400, and 49150, while resistance levels can be identified at 49950,50200, and 50500 as indicated by the 15-minute charts.
Positional traders should monitor short-term support levels at 49000-47500, with resistance at 50400 -51900.