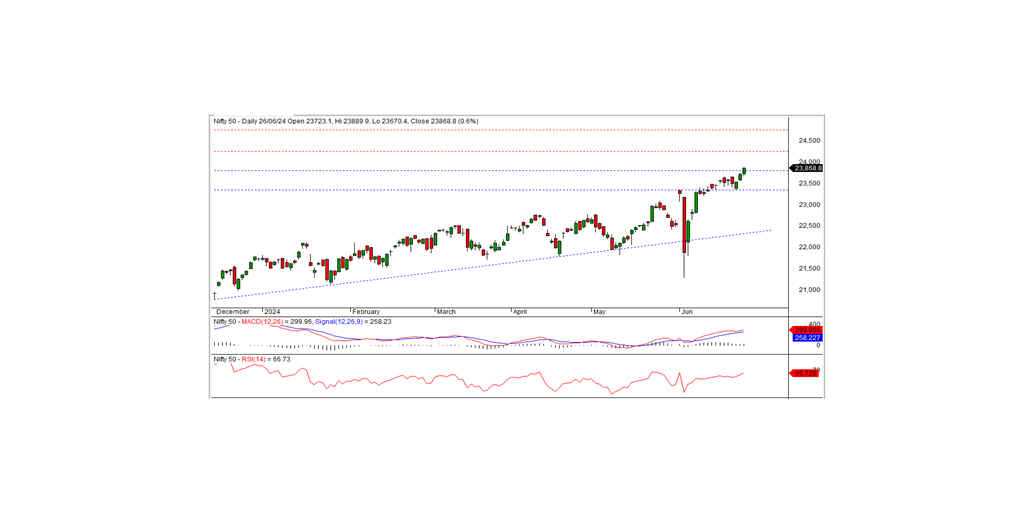
Nifty Technical Outlook
Based on Market Closing on Wednesday, June 26, 2024
In the last trading session, the Nifty closed at a record high of 23,868.80, up 147.50 points or 0.62 percent. A further positive trend can be expected in the coming days if the index remains above the 23,815 level.
The Nifty opened flat at 23,723.10 and hit an intraday low of 23,670.40 in the morning trade. The index then gradually rose, testing a record high of 23,889.90 before closing at 23,868.80. The media, banks, financial services, and FMCG sectors were top gainers, while the metal, realty, auto, and IT sectors were among the losers. The market breadth was negative, with 1,128 stocks rising, 1,371 falling, and 121 remaining unchanged. The top gainers in the Nifty index were Reliance, Bharti Airtel, UltraTech Cement, and ICICI Bank. Conversely, the major losers included Apollo Hospitals, M&M, Bajaj Auto, and Tata Steel.
From a technical standpoint, the momentum indicators signal a positive trend. The Nifty remains above both the long-term and short-term moving averages. Moreover, the index formed a white candle on the daily chart and closed at a record high. This pattern indicates the possibility of continuing the bullish trend. On the lower side, the index has intraday support at the 23,815 level. The positive trend can continue today if the index remains above this level. The nearest intraday resistance is at the 23,900 level.
Intraday Levels: Support: 23,815, 23,750, 23,675 Resistance: 23,900, 23,975, 24,875 (15-Minute Charts)
Positional Trading: Short-term Support: 23,800-23,350 Resistance: 24,250-24,750
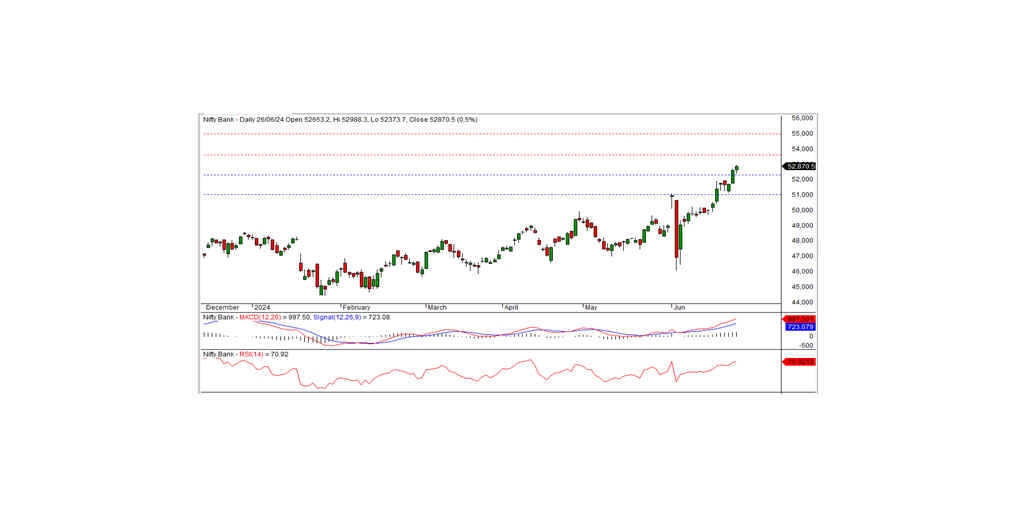
Bank Nifty Technical Outlook
In the preceding trading session, Bank Nifty closed at a record high of 52,870.50, registering a gain of 264.50 points. Technically, the momentum indicators signal a positive trend, with the index remaining above the medium-term and short-term moving averages. Additionally, the index formed a white candle on the daily chart and closed near the record high. On the higher side, the index has intraday resistance at the 53,000 level. If the index moves above this level, the bullish trend can continue in the coming days. The nearest intraday support is at the 52,675 level.
Intraday Levels: Support: 52,675, 52,400, 52,150 Resistance: 53,000, 53,250, 53,500 (15-Minute Charts)
Positional Trading: Short-term Support: 52,300-51,000 Resistance: 53,600-55,000