NIFTY TECHNICAL OUTLOOK
Based on Market Closing on Tuesday, December 31, 2024
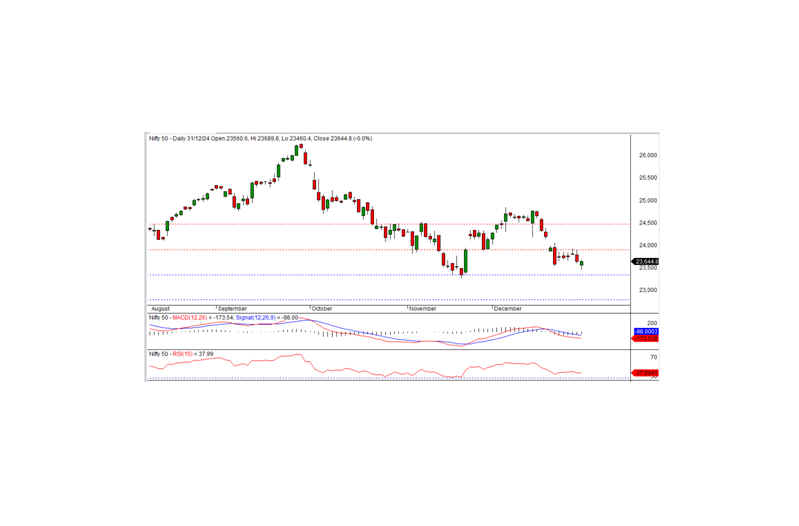
The Nifty closed at 23,644.80 in the previous session, ending on a flat note. To establish a pullback rally, the index must surpass the immediate intraday resistance at 23,700.
During the session, the Nifty opened with a negative bias at 23,560.60 and hit an intraday low of 23,460.40 in the morning trade. However, the index gradually recovered, testing the intraday high of 23,689.80 before closing at 23,644.80. Sector-wise, pharma, PSU banks, metals, and FMCG were the biggest gainers, while IT, financial services, and banking sectors faced losses. Market breadth was positive, with 1,627 stocks advancing, 1,077 declining, and 137 remaining unchanged. Key gainers in the Nifty included BEL, ONGC, KOTAKBANK, and TRENT, while major losers were ADANIENT, TECHM, TCS, and INFY.
From a technical perspective, momentum indicators suggest a negative bias, with the Nifty trading below its short-term and long-term moving averages. However, the formation of a small white candle on the daily chart, coupled with a close near the previous day’s level, indicates the potential for consolidation. On the upside, the immediate intraday resistance remains at 23,700. A breakout above this level could trigger a pullback rally, while failure to do so may result in continued consolidation. On the downside, the index has key intraday support at 23,580; a breach below this could lead to further declines, with the next support at 23,460.
Intraday Levels: Support: 23,580, 23,460, 23,350 Resistance: 23,700, 23,800–23,900
Positional Levels: Short-term Support: 23,300–22,750 Resistance: 23,900–24,500

BANK NIFTY TECHNICAL OUTLOOK
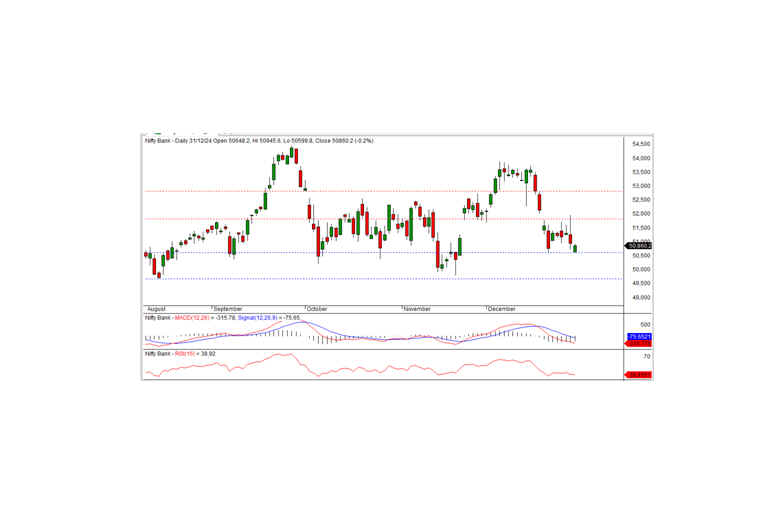
In the preceding session, Bank Nifty closed at 50,860.20, recording a minor loss of -92.55 points. From a technical perspective, momentum indicators suggest a prevailing negative trend, with the index trading below its short-term and medium-term averages.
Despite forming a white candle on the daily chart, the index closed below the prior day’s close, reflecting a bearish sentiment and a potential continuation of the downtrend. On the downside, immediate short-term support is seen at 50,600, and a breach below this level could reinforce the negative bias. Conversely, the nearest intraday resistance stands at 51,000. The index must move decisively above this resistance level for any meaningful pullback rally.
Intraday Levels: Support: 50,600, 50,300, 50,000 Resistance: 51,000, 51,300, 51,600
Positional Levels: Short-term Support: 50,600–49,600 Resistance: 51,800–52,800

