NIFTY TECHNICAL OUTLOOK
Based on Market Closing on Thursday, February 06, 2025
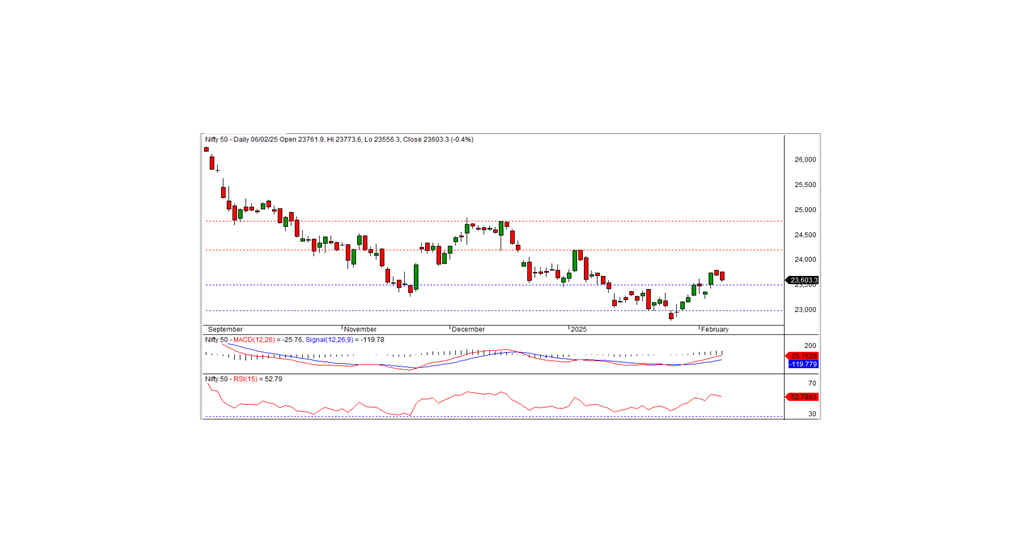
The Nifty closed at 23,603.35, down 92.95 points (0.39%) in the previous session. The downtrend is likely to continue if the index moves below the 23,570 level.
The session began with a positive opening at 23,761.90, but the index failed to sustain its momentum, gradually declining to an intraday low of 23,556.30 before closing lower. Sector-wise, pharma, IT, and private banks were the top gainers, while realty, FMCG, auto, and metals witnessed declines. Market breadth was negative, with 1,236 stocks advancing, 1,491 declining, and 134 remaining unchanged. The biggest gainers in the Nifty included CIPLA, ADANIPORTS, INFY, and TATACONSUM, while TRENT, BEL, BHARTIARTL, and TITAN were the top losers.
Technically, the index remains above its short-term moving averages, and momentum indicators signal a bullish trend. However, the formation of a black candle on the daily chart, coupled with a close below the previous day's level, suggests a slightly negative bias. On the downside, intraday support lies at 23,570, and holding above this level may trigger a positive trend. Otherwise, selling pressure may persist. The nearest intraday resistance is at 23,670, and a breakout above this level could support a rebound.
Key Levels to Watch
Intraday Levels: Support: 23,570, 23,460, 23,365 Resistance: 23,670, 23,770, 23,850
Positional Trading: Short-term Support: 23,500–23,000 Resistance: 24,200–24,775
Conclusion:
Despite the overall bullish trend, the Nifty’s failure to sustain gains and the formation of a black candle indicate caution. Holding above 23,570 is key for a recovery, while a break below this level could extend the downtrend. Traders should watch for a move above 23,670 to confirm renewed buying momentum.

BANK NIFTY TECHNICAL OUTLOOK
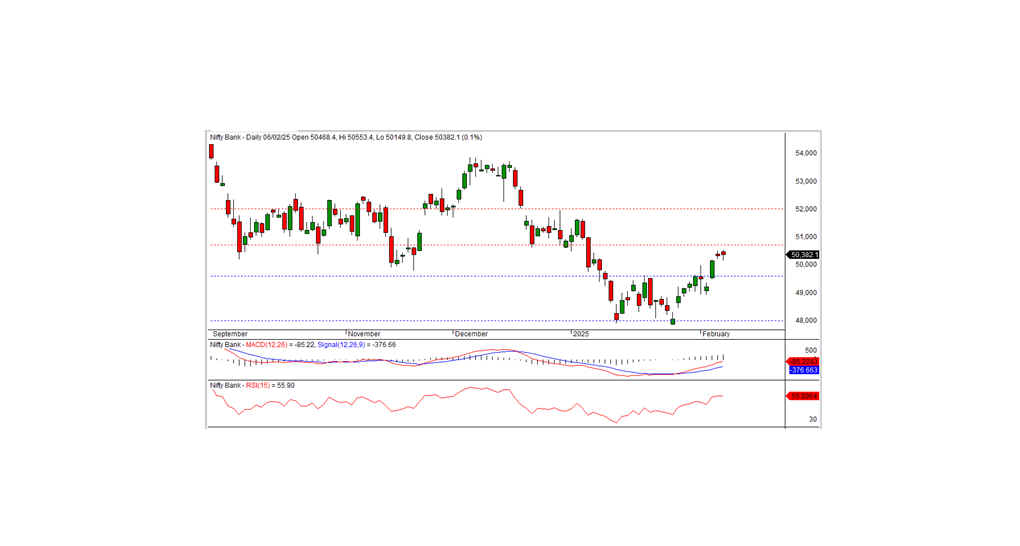
In the preceding session, Bank Nifty closed at 50,382.10, gaining 39.05 points. The technical indicators suggest a positive trend, with the index holding above its short-term moving averages.
The index formed a small black candle on the daily chart but closed higher than the previous session, indicating that bullish momentum remains intact. On the higher side, immediate intraday resistance is at 50,500; a breakout above this level could extend the uptrend toward the next resistance at 50,700. On the lower side, 50200 serves as the nearest support, and a move below this level could lead to consolidation or mild weakness.
Key Levels to Watch
Intraday Levels: Support: 50,200, 49,900, 49,660 Resistance: 50,500, 50,800, 51,100
Positional Trading: Short-term Support: 49,600–48,000 Resistance: 50,700–52,000

