NIFTY TECHNICAL OUTLOOK
Based on Market Closing on Tuesday, June 18, 2024
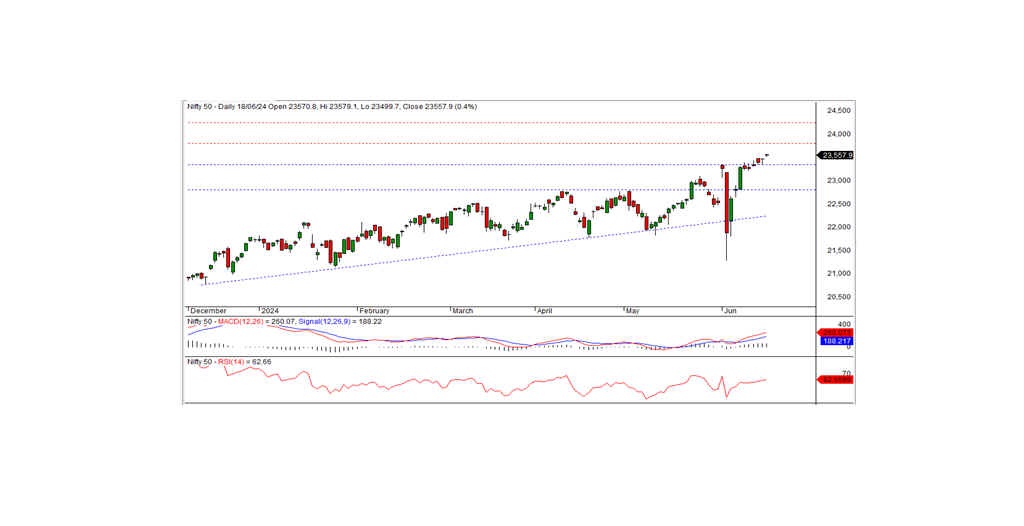
In the last trading session, the Nifty closed at a record high of 23,557.90, gaining 92.30 points or 0.99 percent. The positive trend is expected to continue as long as the index stays above the 23,500 level.
The Nifty opened positively at 23,570.80, dipped to an intraday low of 23,499.70 during the morning trade, then gradually rose to test an intraday high of 23,579.10, and finally closed at 23,557.90. The biggest gainers were the realty, banks, financial services, and IT sectors, while the major losers were the media, pharma, metal, and FMCG sectors. Market breadth was positive, with 1,439 stocks rising, 1,092 falling, and 83 remaining unchanged.
The top gainers in the Nifty index were SHRIRAMFIN, POWERGRID, WIPRO, and TITAN. On the other hand, the major losers included MARUTI, DR REDDY, TATA STEEL, and ULTRACEMCO.
From a technical standpoint, momentum indicators signal a positive trend. The Nifty remains above the long-term and short-term moving averages, forming a Doji candle on the daily chart and closing at a record high. This pattern indicates a potential continuation of the uptrend. The index has intraday support at the 23,500 level; staying above this level will likely sustain the bullish trend in the coming days. The nearest intraday resistance is at the 23,580 level.
Intraday Levels: Support: 23,500, 23,425, 23,340 Resistance: 23,580, 23,635-23,700 (15-Minute Charts)
Positional Trading: Short-term support: 23,340-22,800 Resistance: 23,800-24,250
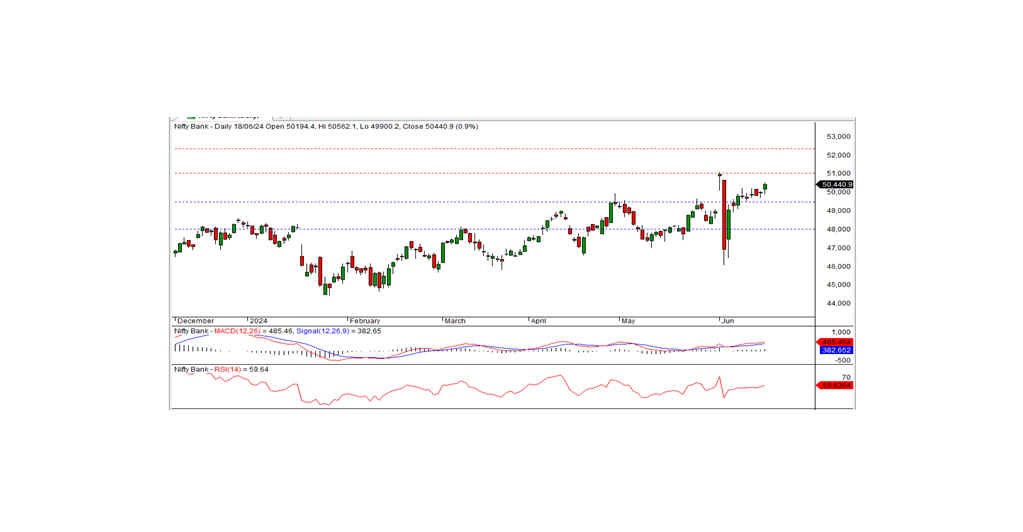
BANK NIFTY
In the preceding trading session, Bank Nifty closed at 50,440.90, registering a gain of 438.90 points. Technically, momentum indicators signal a positive trend, and the index remains above the medium-term and short-term moving averages. The index formed a white candle on the daily chart and closed above the upper bound of the previous few days' candles, indicating momentum in favor of the bulls. On the higher side, the index faces intraday resistance at the 50,560 level. If the index moves above this level, the bullish trend will likely continue in the coming days. The nearest intraday support is at the 50,400 level.
Intraday Levels: Support: 50,400, 50,230, 50,080 Resistance: 50,560, 50,735, 50,900 (15-Minute Charts)
Positional Trading: Short-term support: 49,500-48,000 Resistance: 51,000-52,300