NIFTY TECHNICAL OUTLOOK
Based on Market Closing on Wednesday, June 19, 2024
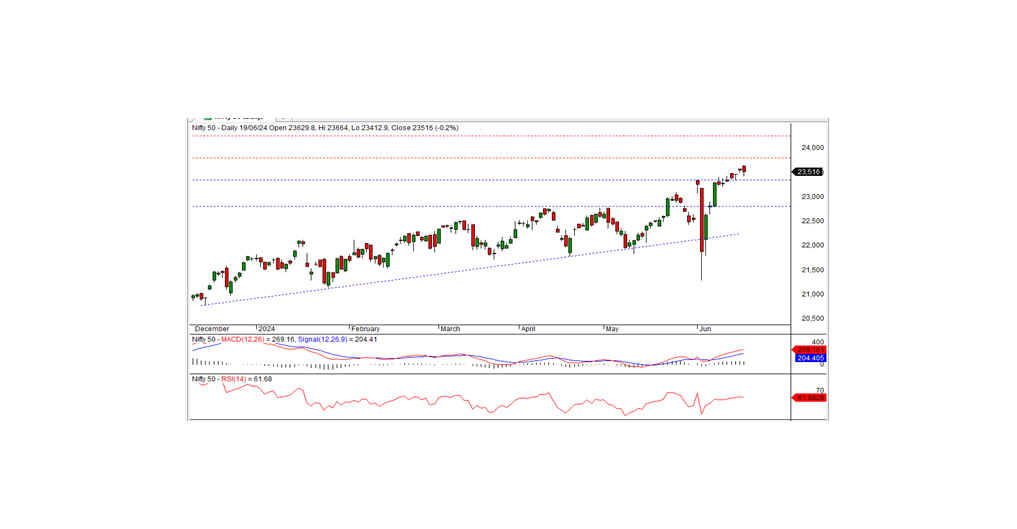
In the last trading session, the Nifty closed at 23,516.00, down 41.90 points or 0.18%. The downward bias will likely continue if the index moves below the 23,500 level.
The Nifty opened positively at 23,629.80 but fell sharply to an intraday low of 23,412.90 during the morning trade. Subsequently, the index gradually rose, testing a record high of 23,664.00, but finally closed at 23,516.00, below the previous day's close.
Sector-wise, banks, financial services, and IT were the gainers, while the major losers included realty, auto, media, and metal sectors. The market breadth was negative, with 978 stocks rising, 1,533 falling, and 103 remaining unchanged. The top gainers in the Nifty index were HDFC Bank, Axis Bank, ICICI Bank, and Kotak Mahindra Bank. In contrast, the major losers were Titan, Larsen & Toubro, Maruti Suzuki, and Bharti Airtel.
From a technical standpoint, momentum indicators signal a positive trend as the Nifty remains above both long-term and short-term moving averages. However, the index formed a black candle on the daily chart and closed below the previous day's close, indicating a slightly negative bias. On the lower side, the index has intraday support at the 23,500 level. If the index moves below this level, the downward bias will continue. The nearest intraday resistance is at the 23,580 level, and for a pullback rally, the index needs to surpass this level.
The intraday support levels are at 23,500, 23,425, and 23,340, while the intraday resistance levels are at 23,580, 23,635, and 23,700 (based on 15-minute charts).
For positional trading, short-term support is at 23,340 to 22,800, and resistance is between 23,800 and 24,250.
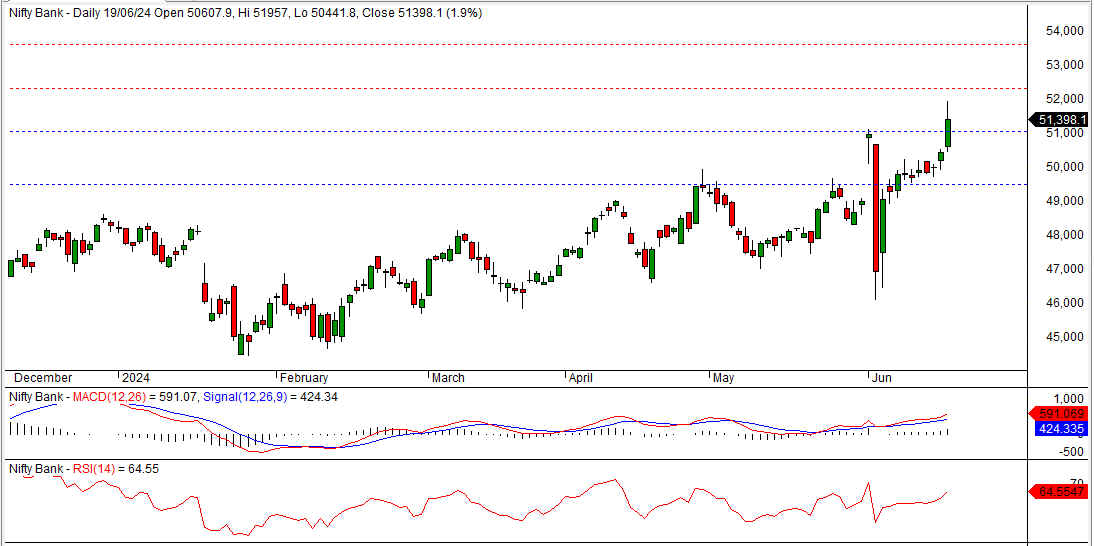
BANK NIFTY TECHNICAL OUTLOOK
In the preceding trading session, Bank Nifty closed at a record high of 51,398.05, registering a gain of 957.15 points. Technically, the momentum indicators signal a positive trend, and the index remains above the medium-term and short-term moving averages. Additionally, the index formed a white candle on the daily chart and closed above the previous resistance level of 51,000, indicating that momentum remains in favor of the bulls. If the index stays above the 51,000 level, the bullish trend is expected to continue in the coming days. The nearest intraday resistance is at the 51,500 level.
For intraday traders, the support levels are at 51,200, 50,900, and 50,600, while resistance levels are at 51,500, 51,750, and 52,000, as indicated by the 15-minute charts.
Positional traders should monitor short-term support levels at 51,000 to 49,500, with resistance at 52,300 to 53,600.