NIFTY TECHNICAL OUTLOOK
Based on Market Closing on Thursday, January 16, 2025
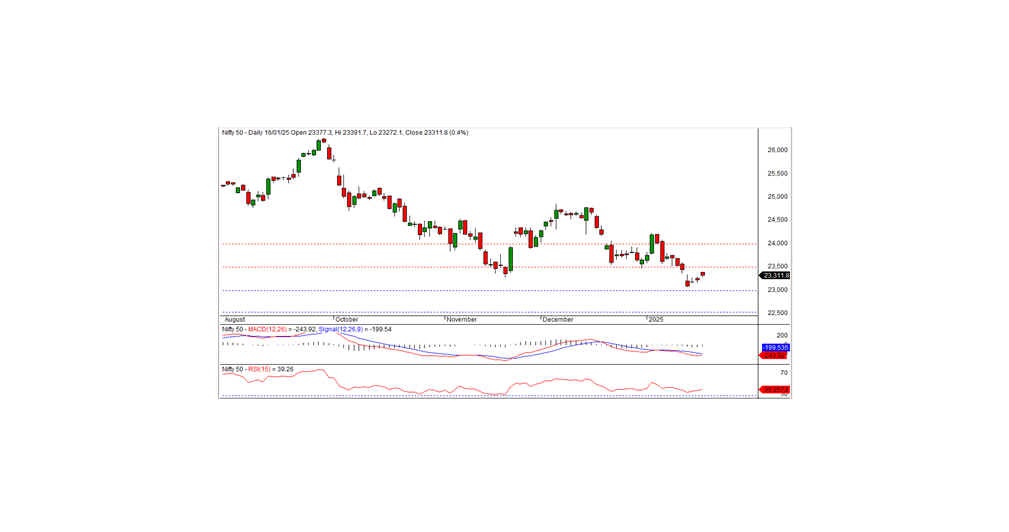
The Nifty ended the session at 23,311.80, gaining 98.60 points or 0.42%. The index must sustain above the intraday support level of 23,275 to maintain its positive momentum.
In the previous session, Nifty opened on a positive note at 23,377.30, quickly testing the intraday high of 23,391.70. However, it gradually retraced, touching an intraday low of 23,272.10 before closing at 23,311.80. Sectorally, PSU banks, metals, financial services, and banking stocks emerged as the top gainers, while FMCG, IT, and pharma sectors faced selling pressure.
The market breadth reflected a positive sentiment, with 1,963 stocks advancing, 723 declining, and 159 remaining unchanged. Among the Nifty constituents, HDFCLIFE, BEL, SBILIFE, and SHRIRAMFIN were the top performers, while TRENT, DRREDDY, TATACONSUM, and HCLTECH were the major laggards.
Technical Analysis:
Momentum indicators continue to signal a negative trend, with the index trading below its short-term and long-term moving averages. On the daily chart, a small black candle was formed, but the Nifty closed higher than the previous session, indicating a mildly positive bias.
The Nifty has immediate intraday support at 23,275. Sustaining above this level could help the index retain its upward trajectory. Conversely, a breach of this level may lead to a slight downturn, with further support at 23,150 and 23,050. The overall trend will depend on whether the index can sustain above the key support at 23,275. A close above 23,365 may signal a continuation of the positive trend, while failure to hold support levels could result in a corrective phase.
Intraday Levels: Support: 23,275, 23,150, 23,050 Resistance: 23,365, 23,475–23,565
Positional Trading Levels: Support: 23,000–22,500 Resistance: 23,500–24,000

BANK NIFTY TECHNICAL OUTLOOK
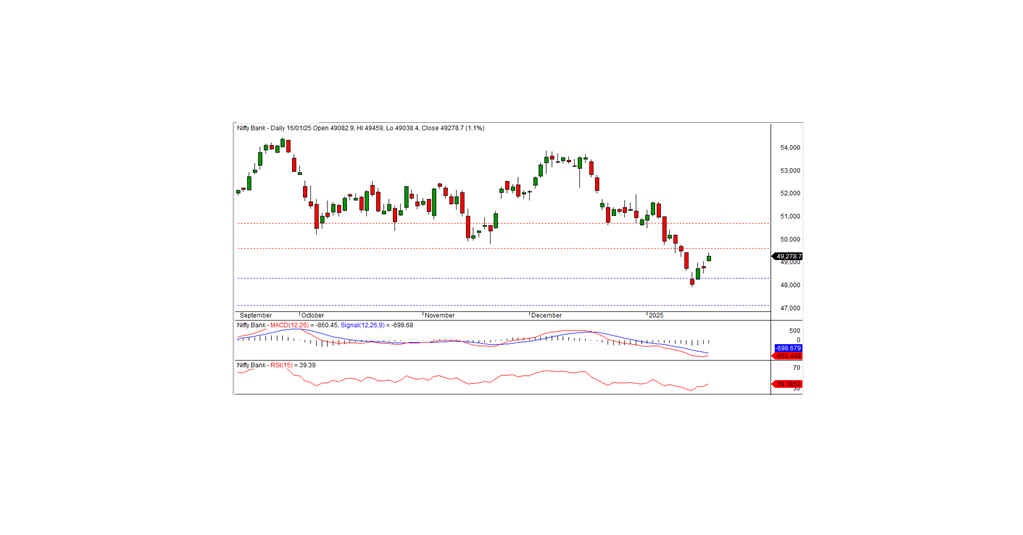
In the previous session, Bank Nifty closed at 49,278.70, posting a gain of 527 points. Despite this positive move, technical momentum indicators continue to suggest a negative trend, with the index trading below its short-term and long-term moving averages.
On the daily chart, the index formed a small white candle, closing above the prior session's close. This pattern reflects a mildly positive bias. The immediate intraday resistance is at 49,450. A breakout above this level could sustain the upward momentum in the coming sessions. Key support is at 49,100. If the index breaks below this level, a slightly negative trend may emerge.
Intraday Levels (15-Minute Chart): Support: 49,100, 48,800, 48,500 Resistance: 49,450, 49,700, 50,000
Positional Trading Outlook: Support: 48,300–47,250 Resistance: 49,600–50,700
Traders should monitor whether the index sustains above 49,450 to confirm continued positivity, while a breach below 49,100 could signal a shift toward a weaker trend.

