NIFTY Technical Analysis
Based on Market Closing on Friday, April 26, 2024
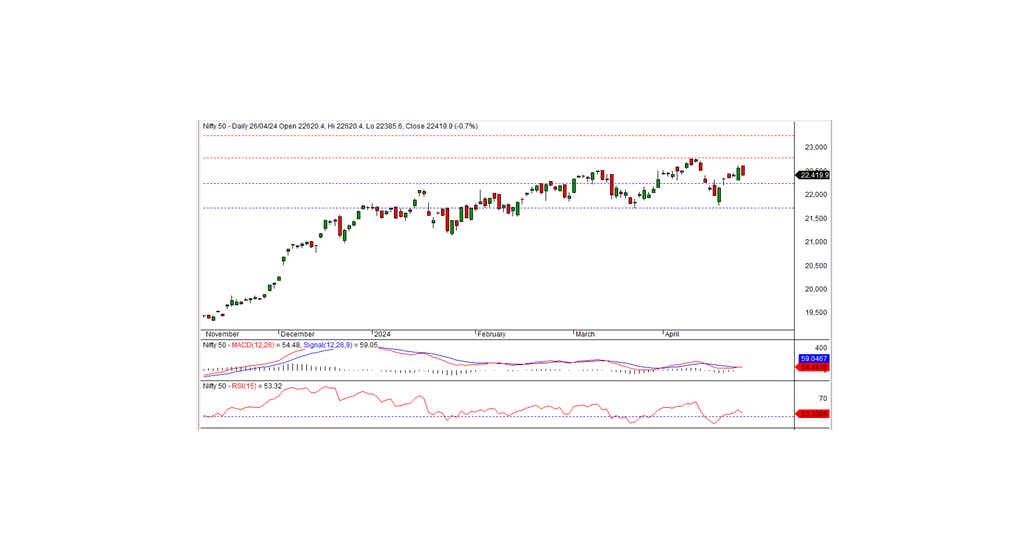
In the last trading session, the Nifty closed at 22,419.95, marking a decline of 150.40 points or -0.67 percent. Sustained trading below the intraday support level of 22,385 could prolong the prevailing downtrend.
Despite opening positively at 22,620.40, the Nifty failed to maintain momentum, gradually descending to an intraday low of 22,385.60 before settling at 22,419.95. Noteworthy sectoral gainers were media, pharmaceuticals, real estate, and IT, while financial services, banking, and automotive sectors experienced significant losses. Market breadth favored positivity, with 1234 stocks rising, 1214 falling, and 152 remaining unchanged. Notable performers within the Nifty included TECHM, DIVISLAB, LTIM, and BAJAJ-AUTO, while BAJFINANCE, BAJAJFINSV, INDUSINDBK, and NESTLEIND faced notable declines.
From a technical perspective, the Nifty maintains positions above short-term and long-term moving averages, with momentum indicators signaling a favorable trend. However, the formation of a black candle on the daily chart, coupled with a close near the day's low, suggests a slightly negative bias. On the downside, the index finds intraday support at 22,385. Should the index trade and sustain below this level, a further downtrend could ensue. Conversely, a break above the resistance at 22,475 would signal the potential for a pullback rally.
Intraday Levels: Support: 22,385, 22,300, 22,220 Resistance: 22,475, 22,500, 22,625 (15-Minute Charts)
Positional Trading: Short-term support: 22,250-21,700 Resistance: 22,775-23,250
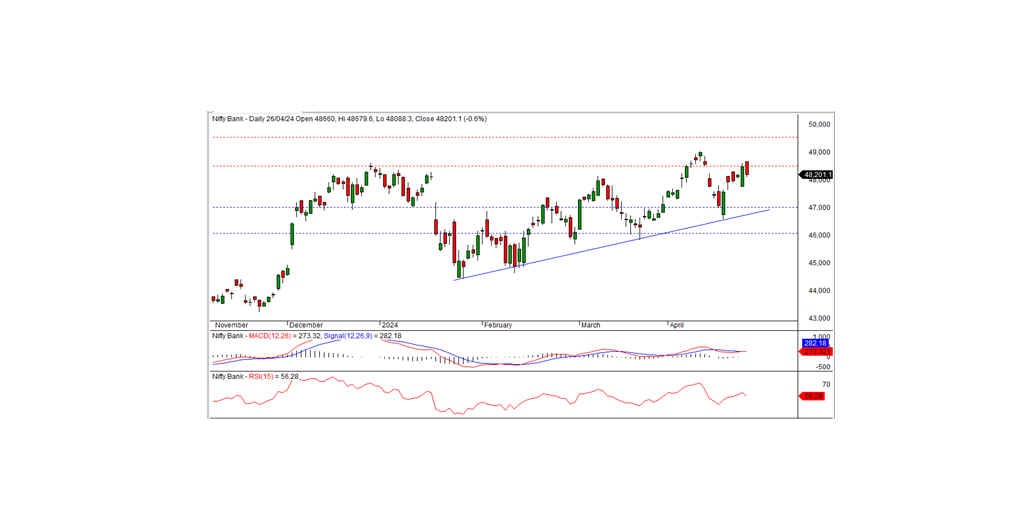
BANK NIFTY Technical Analysis
In the preceding trading session, Bank Nifty concluded at 48,201.05, marking a loss of 293.90 points. Technically, momentum indicators signal a positive trend, with the index positioned above both short-term and long-term moving averages. However, the formation of a black candle on the daily chart, coupled with a close near the day's low, hints at a slightly negative bias.
On the downside, the index finds intraday support at the 48,100 level. Should the index breach this level, the downtrend may persist. Conversely, the nearest intraday resistance lies at 48,300, and a breakthrough could signify a potential pullback rally.
For intraday traders, support levels are identified at 48,100, 47,860, and 47,650, while resistance levels are noted at 48,300, 48,500, and 48,675, as indicated by the 15-minute charts.
Positional traders are advised to monitor short-term support levels at 47,000-46,000, with resistance at 48,500-49,500.